This applies to: Visual Data Discovery Launch the Visual Data Discovery work area by selecting the appropriate Open button on the Symphony home page. You can access any tasks you need to accomplish in the Visual Data Discovery module here. Use the main menu to navigate to any available connections, data sources, the visual gallery, and libraries. Select the All Content icon while working in the data discovery module to return to this work area.Documentation Index
Fetch the complete documentation index at: https://insightsoftware-preview.mintlify.app/llms.txt
Use this file to discover all available pages before exploring further.
 ) and collapse (
  ) arrows to expand and collapse the pane. Depending on the module you’re working in, your application privileges, and licensed features, the menu reflects what you can do. Select the Home button at any time to return to the home page and navigate to another section or module of Symphony.
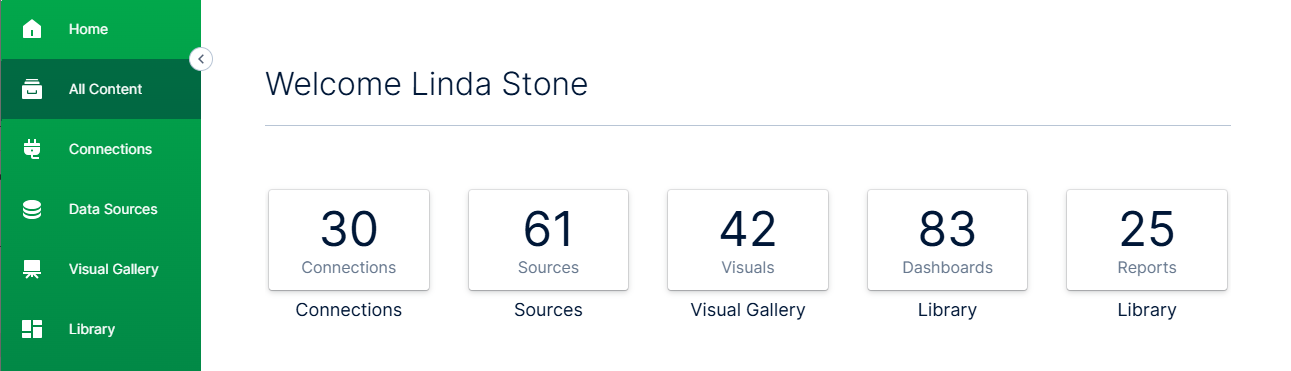
The main pane of this work area, by default, displays the number of connections, data sources, visuals, dashboards, and self service reports you can access in your environment. Select Connections, Sources, Visual Gallery, or a Library option to access available content. You will not see information or links to resources your application privileges restrict you from accessing. Available options you may see include:
) arrows to expand and collapse the pane. Depending on the module you’re working in, your application privileges, and licensed features, the menu reflects what you can do. Select the Home button at any time to return to the home page and navigate to another section or module of Symphony.
The main pane of this work area, by default, displays the number of connections, data sources, visuals, dashboards, and self service reports you can access in your environment. Select Connections, Sources, Visual Gallery, or a Library option to access available content. You will not see information or links to resources your application privileges restrict you from accessing. Available options you may see include:
| Category | Description |
|---|---|
| Connections | Shows the number of connections defined in your environment. Select this box to manage connections to data stores. The Connections page appears. See Manage Data Discovery Data Store Connections. |
| Sources | Shows the number of data source configurations defined in your environment. Select this box to manage data source configurations. The Sources page appears. See Manage Visual Data Discovery Data Sources. |
| Visual Gallery | Shows the number of visuals defined in your environment. Select this box to manage visuals in the Visual Gallery. The Visuals page appears. See Manage Visuals and Use the Visual Gallery. |
| Library | Shows the number of dashboards and self service reports defined in your library.
See Manage Dashboards, Use the Library for Dashboards, Use the Self Service Reports Library, and Use the Reports Library. |