When you first create a standard bar chart or a multiple metric bar chart, the default settings specified in the data source configuration are used to create the visuals. Use the Settings sidebar to further refine your selected bar chart.Documentation Index
Fetch the complete documentation index at: https://insightsoftware-preview.mintlify.app/llms.txt
Use this file to discover all available pages before exploring further.
| Setting | Description |
|---|---|
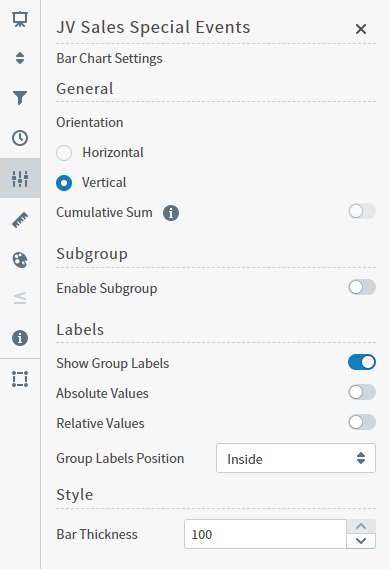
| Orientation | Select Horizontal or Vertical orientation for the bars. |
| Cumulative Sum | When enabled, Composer updates the visual to add the previous value to the next value, and both the original and cumulative value for selected items are displayed as a tool tip. In Bar visuals, this feature is only available when data is grouped by a Time field, and when the Enable Subgroup setting is disabled. |
| Subgroup | Slide on (to the right) the Enable Subgroup: slider to enable a subgroup style. After enabling a subgroup style, select the style for the chart:Clustered Bar Chart:, Stacked Bar Chart:, or 100% Stacked Bar Chart:. If Subgroups are enabled, you can define the visibility and position of their labels. |
| Show Group Labels | Enable to display labels for group values. |
| Absolute Values | Enable to display the data in absolute values. |
| Relative Values | Enable to display the data in relative values. |
| Group Labels Position or Subgroup Labels Position | Select a position option for the group or subgroup labels: Outside horizontal:, Outside diagonal:, or Outside vertical:. |
| Style | Specify the bar thickness for the chart. |