> ## Documentation Index
> Fetch the complete documentation index at: https://insightsoftware-preview.mintlify.site/llms.txt
> Use this file to discover all available pages before exploring further.
# Connect to Data and View it on a Dashboard
**This applies to:** *Managed Dashboards, Managed Reports*
This walkthrough shows you how to add a new connection to a data source and use it to display some data on a dashboard.
A SQL Server/Azure SQL database is used for example purposes, but you can follow these steps for any data source.
## Connecting to Data
If you are accessing data live from a database or online data source, you generally need to have some knowledge about the type of data source as well as the necessary permissions to connect.
You also need to be a user with at least power user access to create a data connector.
### Create a New Data Connector
You can create a data connector a number of different ways:
* Click **Data** in the [main menu](/logi-symphony/symphony/v25/navigate/the_symphony_main_menu) on the left, switch to **Data Connector** , then click **Create**.
* You can also use the options provided when creating a [new metric set](/logi-symphony/symphony/v25/dashboards/select_and_group_data_for_a_metric_set).
* Or, right-click the *Data Connectors* folder in the [Explore window](/logi-symphony/symphony/v25/available_visual_types/design_overview) and choose **New Data Connector**.
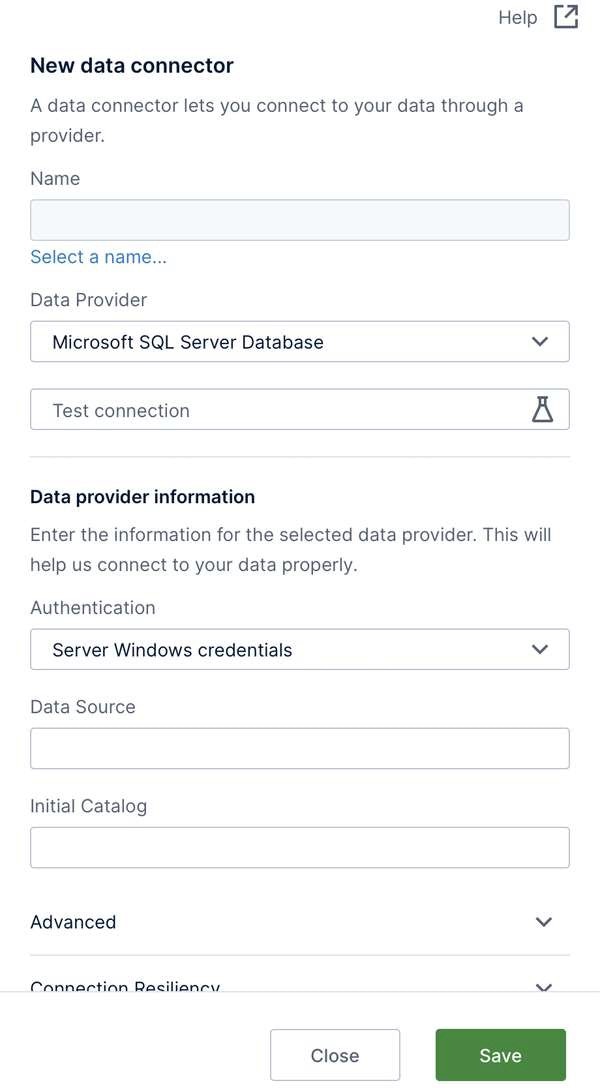
The new data connector dialog appears, with various settings available that change depending on the type of data provider you want to use.
 ### Choose a Name and Folder Location
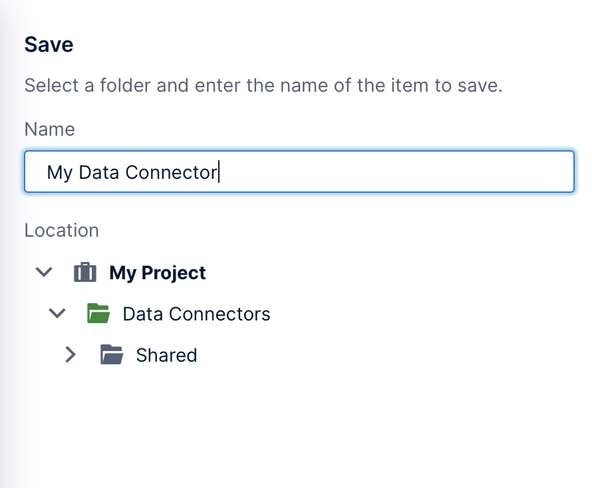
Your new data connector will need a name - click inside the **Name** box to open a dialog where you can enter one.
You can optionally click to select a specific subfolder **Location** under the *Data Connectors* folder. To create a subfolder, right-click (or long-tap) an existing folder and choose **Create Folder**.
### Choose a Name and Folder Location
Your new data connector will need a name - click inside the **Name** box to open a dialog where you can enter one.
You can optionally click to select a specific subfolder **Location** under the *Data Connectors* folder. To create a subfolder, right-click (or long-tap) an existing folder and choose **Create Folder**.
 ### Select a Data Provider
You can connect to a wide range of data source types. The **Data Provider** drop-down is set to *Microsoft SQL Server* by default, which is also used for connecting to Azure SQL and Azure Synapse.
### Select a Data Provider
You can connect to a wide range of data source types. The **Data Provider** drop-down is set to *Microsoft SQL Server* by default, which is also used for connecting to Azure SQL and Azure Synapse.
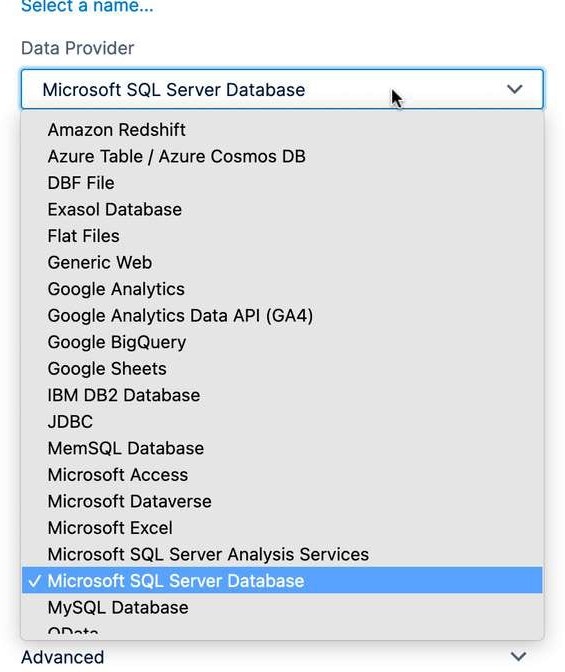 The settings below may change after changing the data provider.
Your administrator may need to install drivers on the server for certain data providers.
### Settings
You can hover over each data provider setting for a tooltip popup providing a description (or long-tap on touch devices).
The settings below may change after changing the data provider.
Your administrator may need to install drivers on the server for certain data providers.
### Settings
You can hover over each data provider setting for a tooltip popup providing a description (or long-tap on touch devices).
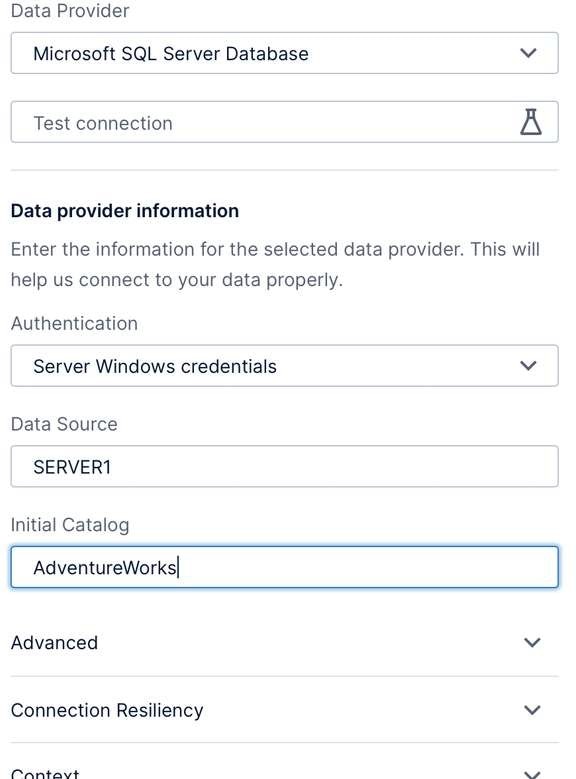 Some data providers offer more than one authentication method you can choose from, such as:
* Server Windows credentials
* Provider-specific options such as SQL Server authentication
* Specified Windows credentials
* Impersonated Windows credentials
* Active Directory credentials, for use with Azure
Fill in the requested credentials if required.
When connecting to any database, there may be settings similar to the following ones for Microsoft SQL Server:
* **Data Source** - The name of your database instance or database server (e.g., often this is just the server name), or its network/internet address.
* **Initial Catalog** - The database name.
There are typically other optional or advanced settings you can configure. Click through the expandable sections near the bottom to access additional settings.
**Note:** Enable **Allow Session Schemas** for supported connectors to use session schemas. See Session Schema.
**Important:** If you disable Trusted Access in a multi-tenancy environment, data retrieved through the Data Discovery connector you created is fetched using the tenant admin's credentials instead of each user's credentials. Effectively, all row level security settings are removed on the data retrieved.
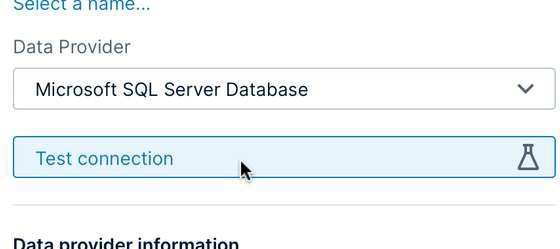
### Test the Connection
You can click **Test connection** as a quick way of verifying the settings you just entered. A message will appear in the bottom-right corner of your browser window indicating whether the connection was successful.
Some data providers offer more than one authentication method you can choose from, such as:
* Server Windows credentials
* Provider-specific options such as SQL Server authentication
* Specified Windows credentials
* Impersonated Windows credentials
* Active Directory credentials, for use with Azure
Fill in the requested credentials if required.
When connecting to any database, there may be settings similar to the following ones for Microsoft SQL Server:
* **Data Source** - The name of your database instance or database server (e.g., often this is just the server name), or its network/internet address.
* **Initial Catalog** - The database name.
There are typically other optional or advanced settings you can configure. Click through the expandable sections near the bottom to access additional settings.
**Note:** Enable **Allow Session Schemas** for supported connectors to use session schemas. See Session Schema.
**Important:** If you disable Trusted Access in a multi-tenancy environment, data retrieved through the Data Discovery connector you created is fetched using the tenant admin's credentials instead of each user's credentials. Effectively, all row level security settings are removed on the data retrieved.
### Test the Connection
You can click **Test connection** as a quick way of verifying the settings you just entered. A message will appear in the bottom-right corner of your browser window indicating whether the connection was successful.
 ### Save
At the bottom of the dialog, the **Check In** option is checked by default to [share the data connector with other users](/logi-symphony/symphony/v25/dashboards/check_in,_check_out_and_auto_saving) with access to the current project as soon as it's created.
### Save
At the bottom of the dialog, the **Check In** option is checked by default to [share the data connector with other users](/logi-symphony/symphony/v25/dashboards/check_in,_check_out_and_auto_saving) with access to the current project as soon as it's created.
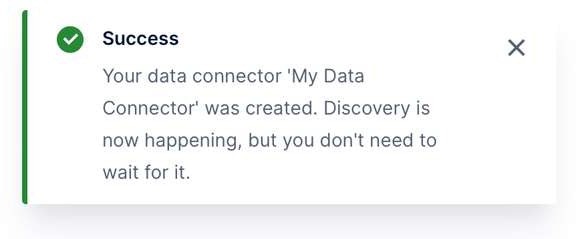
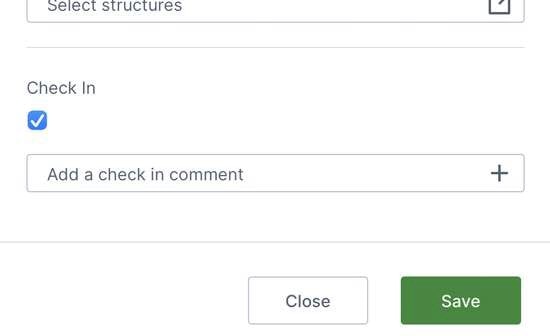 Finally, click to **Save** at the bottom. A message will tell you the data connector was created and that a discovery operation was started - this process automatically finds and lists all the tables, stored procedures, and other available data 'structures' for you to work with, and it runs in the background so you don't need to wait for it.
 **Note:** Stored Procedures that don't output a value are not supported.
If you want to make changes to the data connector, you can re-open it from the main menu.
## Viewing Data
Now that you have a data connector providing access to a data source, you can display some data using a metric set or dashboard, for example. The quick walkthrough below shows a dashboard.
### Create a New Dashboard
Click on **Views** in the [main menu](/logi-symphony/symphony/v25/navigate/the_symphony_main_menu) and create a new dashboard. Choose *Blank* to drag and drop content anywhere on the dashboard, or you can choose another template.
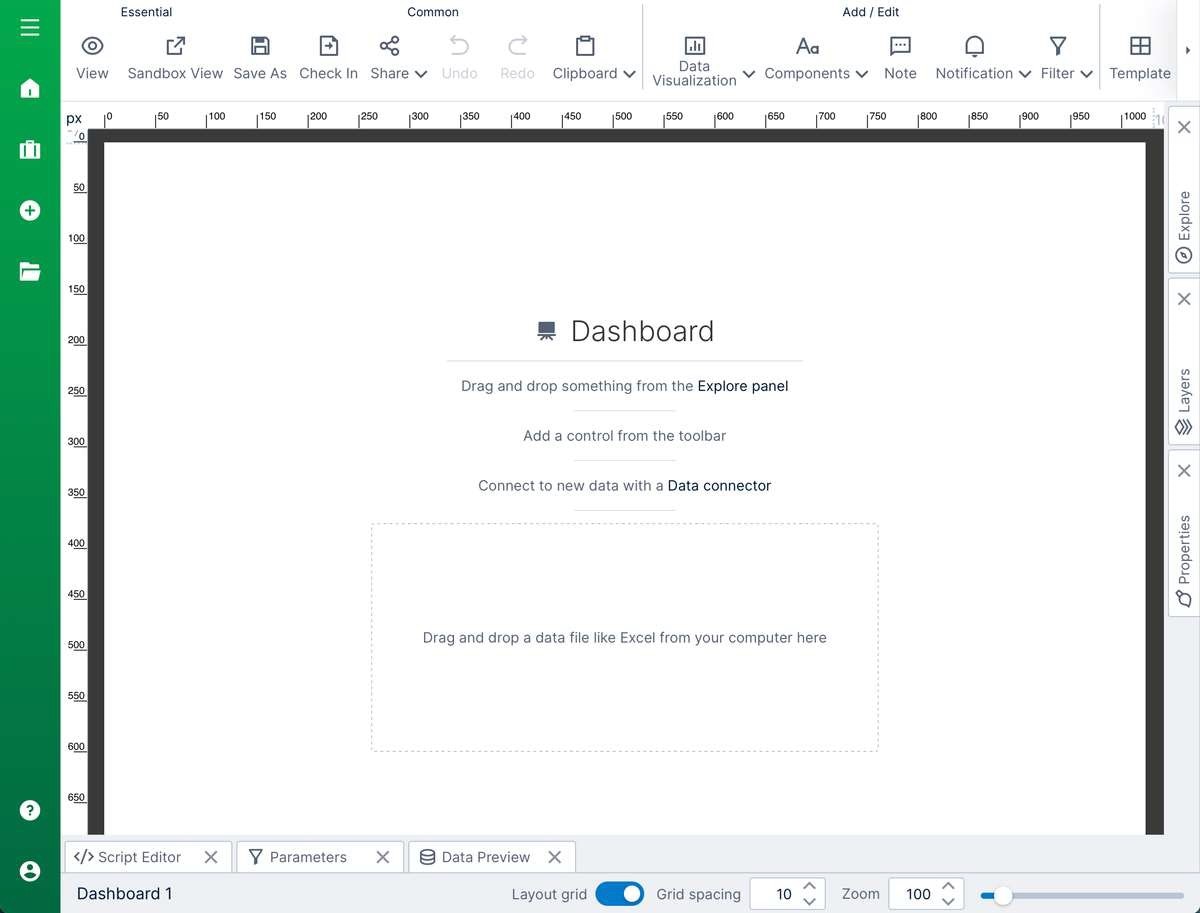
The [dashboard editor](/logi-symphony/symphony/v25/available_visual_types/design_overview) is displayed, with most of the screen taken up by a *canvas* where you can drag and drop items to compose your dashboard.
**Note:** Stored Procedures that don't output a value are not supported.
If you want to make changes to the data connector, you can re-open it from the main menu.
## Viewing Data
Now that you have a data connector providing access to a data source, you can display some data using a metric set or dashboard, for example. The quick walkthrough below shows a dashboard.
### Create a New Dashboard
Click on **Views** in the [main menu](/logi-symphony/symphony/v25/navigate/the_symphony_main_menu) and create a new dashboard. Choose *Blank* to drag and drop content anywhere on the dashboard, or you can choose another template.
The [dashboard editor](/logi-symphony/symphony/v25/available_visual_types/design_overview) is displayed, with most of the screen taken up by a *canvas* where you can drag and drop items to compose your dashboard.
 ### Find Your Data Connector
Click on the *Explore* window, usually docked on the right, to expand it if it isn't already. It lists all the items within the current project.
Expand the *Data Connectors* folder to see your data connector, then further expand the data connector itself to see the data structures discovered, including database tables and programmatic structures such as stored procedures and functions.
### Find Your Data Connector
Click on the *Explore* window, usually docked on the right, to expand it if it isn't already. It lists all the items within the current project.
Expand the *Data Connectors* folder to see your data connector, then further expand the data connector itself to see the data structures discovered, including database tables and programmatic structures such as stored procedures and functions.
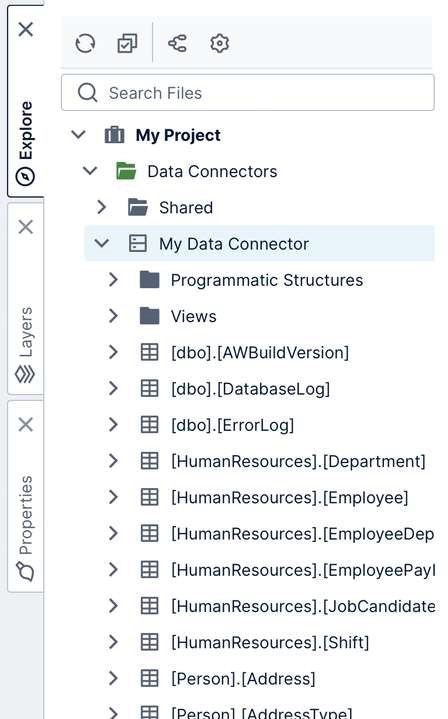 **Note:** If the structures or their columns have changed since they were last discovered, you can right-click/long-tap the data connector or one of its sub-folders and choose Re Discover.
### Drag a Table of Data To the Canvas
Under your data connector, scroll down and locate a specific table or sheet of data you want to see. Expand the table and drag individual columns you are interested in, or drag the entire table to preview all of its [raw data](/logi-symphony/symphony/v25/dashboards/select_and_group_data_for_a_metric_set).
**Note:** If the structures or their columns have changed since they were last discovered, you can right-click/long-tap the data connector or one of its sub-folders and choose Re Discover.
### Drag a Table of Data To the Canvas
Under your data connector, scroll down and locate a specific table or sheet of data you want to see. Expand the table and drag individual columns you are interested in, or drag the entire table to preview all of its [raw data](/logi-symphony/symphony/v25/dashboards/select_and_group_data_for_a_metric_set).
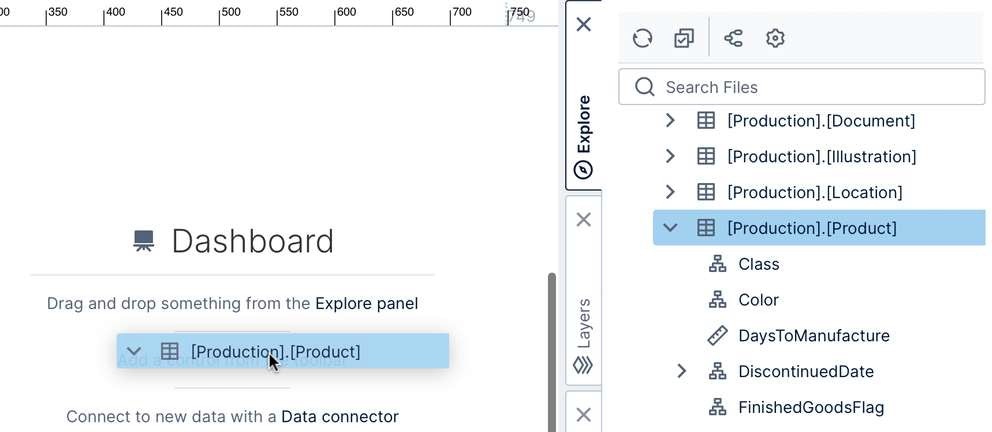 Data sources are connected to live/real-time by default (other than files such as Excel spreadsheets that were uploaded).
Dragging data automatically creates a [metric set](/logi-symphony/symphony/v25/dashboards/symphony_metric_sets) you can use to analyze it. Initially it's visualized as a table, but you can Re-Visualize from the toolbar. Otherwise, a recommended visualization will be chosen for you automatically as you drag or add more data.
### View the Dashboard
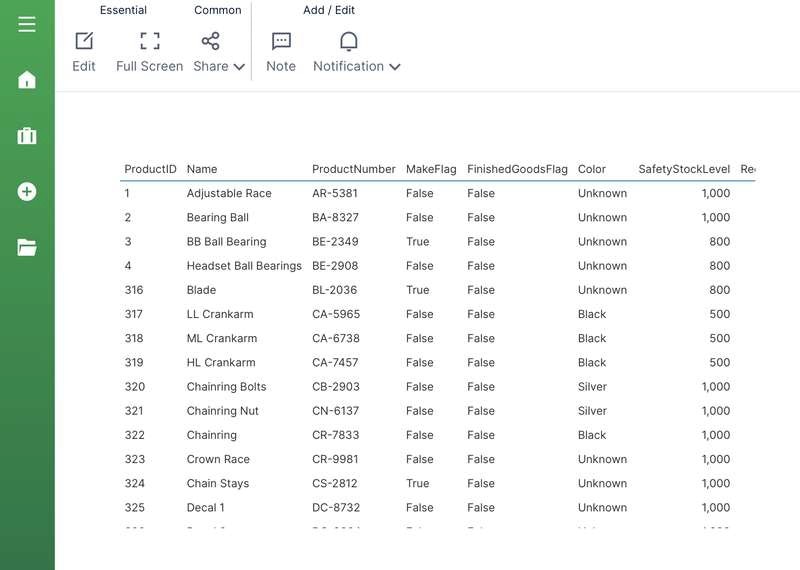
Click **View** in the toolbar to switch to *View mode*. This lets you interact with your dashboard, such as using the scrollbars on the table visualization. Click **Edit** in the toolbar to go back to **Edit mode**.
Data sources are connected to live/real-time by default (other than files such as Excel spreadsheets that were uploaded).
Dragging data automatically creates a [metric set](/logi-symphony/symphony/v25/dashboards/symphony_metric_sets) you can use to analyze it. Initially it's visualized as a table, but you can Re-Visualize from the toolbar. Otherwise, a recommended visualization will be chosen for you automatically as you drag or add more data.
### View the Dashboard
Click **View** in the toolbar to switch to *View mode*. This lets you interact with your dashboard, such as using the scrollbars on the table visualization. Click **Edit** in the toolbar to go back to **Edit mode**.
 For more information, see:
* Authentication Methods
* Connect to OLAP Data and Apply a Formula
* Setting Up Data Input
* Other Metric Set Tools
* Automatic Joins and Hierarchies
* Working With Projects
* [Check In, Check Out and Auto Saving](/logi-symphony/symphony/v25/dashboards/check_in,_check_out_and_auto_saving)
For more information, see:
* Authentication Methods
* Connect to OLAP Data and Apply a Formula
* Setting Up Data Input
* Other Metric Set Tools
* Automatic Joins and Hierarchies
* Working With Projects
* [Check In, Check Out and Auto Saving](/logi-symphony/symphony/v25/dashboards/check_in,_check_out_and_auto_saving)