> ## Documentation Index
> Fetch the complete documentation index at: https://insightsoftware-preview.mintlify.site/llms.txt
> Use this file to discover all available pages before exploring further.
# Create a Dashboard Template
**This applies to:** *Managed Dashboards, Managed Reports*
Use a dashboard template to define a common base or starting point from which to design dashboards. For example, if you want to create a set of dashboards with the same banner and background graphics, you can put these common elements in a dashboard template, and then use the template to create new dashboards. If you ever need to change the common elements, you just need to do this in one place by modifying the template instead of changing multiple dashboards.
Related video:[Dashboard Template](https://www.dundas.com/support/videos/dashboard-template)
## Creating a Template
To create a new template, select **Views** in the [menu](/logi-symphony/symphony/v25/navigate/the_symphony_main_menu#thesymphonymain-menu), select **Create** , then **New Template**.
Edit your new template just like a new dashboard. It's saved in the **Dashboards** folder.
### Adjust the Properties
You can adjust some canvas properties that will affect all of the dashboards based on this template. This includes changing the canvas background, the resize mode, and the font settings.
For example, open **Properties** and indicate the default font settings under **Font & Text**.
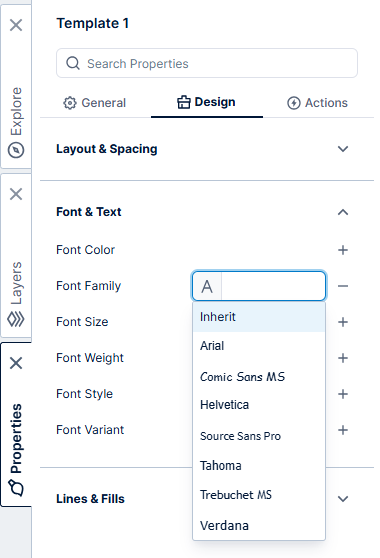 **Note:** This will define the default dashboard-wide font settings, which can be overridden on individual elements.
### Add Elements
You can add elements to the canvas for your template just like you would for a regular dashboard.
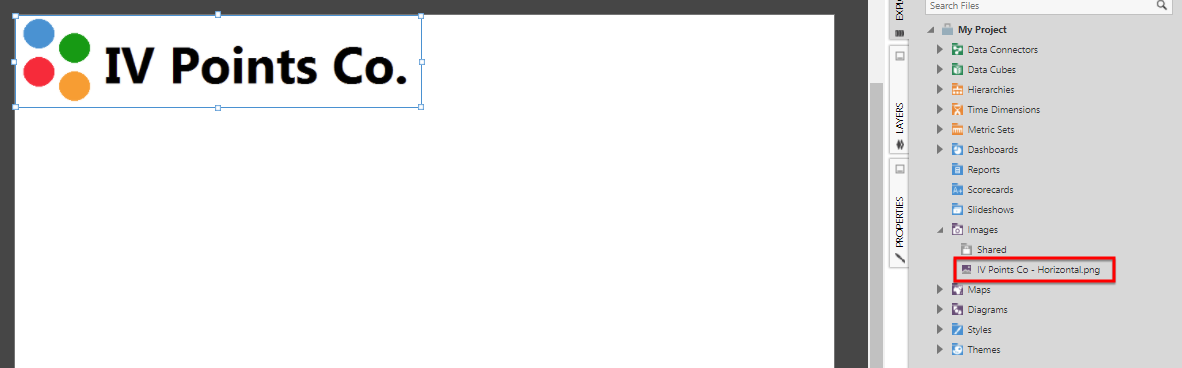
For example, drag an image file from Windows Explorer or Finder and drop it directly onto the template canvas. The image can be used as a banner for a series of related dashboards.
**Note:** This will define the default dashboard-wide font settings, which can be overridden on individual elements.
### Add Elements
You can add elements to the canvas for your template just like you would for a regular dashboard.
For example, drag an image file from Windows Explorer or Finder and drop it directly onto the template canvas. The image can be used as a banner for a series of related dashboards.
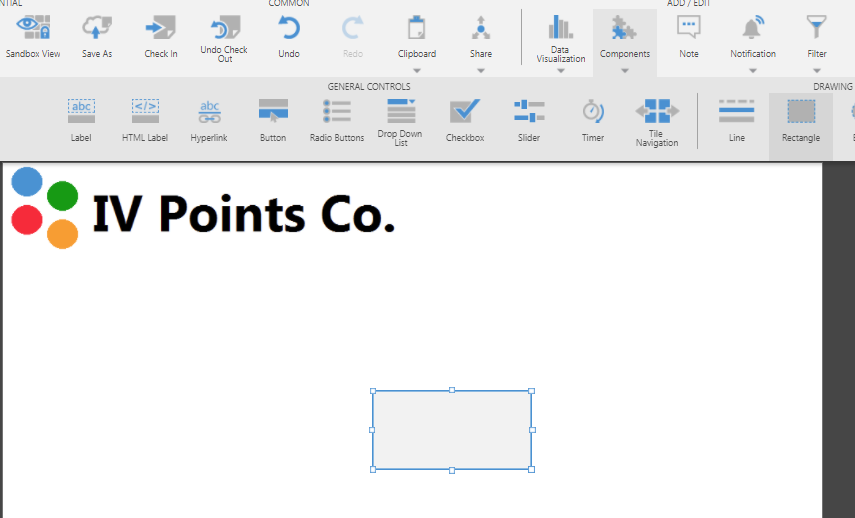
 Next, slect **Components** from the toolbar and select **Rectangle**. This rectangle will serve as a background frame for data visualizations.
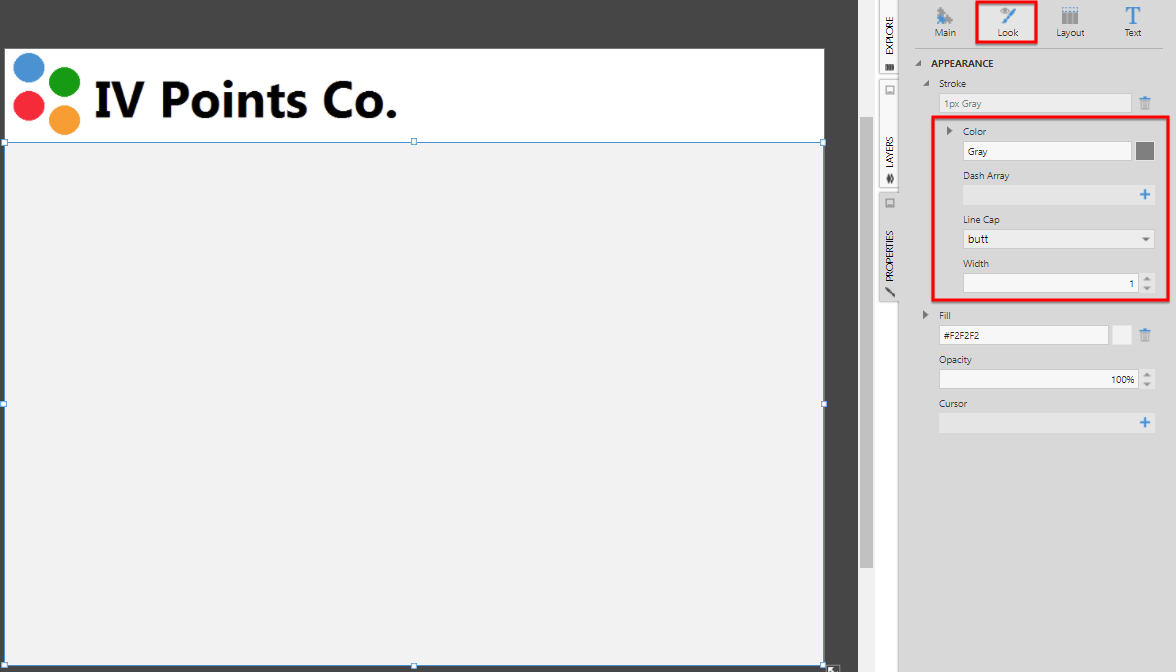
 Reposition and resize the rectangle, then set its appearance properties from the **Properties** window.
 ## Using a Template
* You can use a template when you create a new dashboard: select **Views** in the [main menu](/logi-symphony/symphony/v25/navigate/the_symphony_main_menu#thesymphonymain-menu), select **Create** , and then choose a template from the list that includes the templates you created.
* When editing an existing dashboard, select an empty area of the canvas to de-select any elements, select **Template** in the toolbar, and then choose **Use Existing Template**.
The dashboard will show elements from the template grayed out. You won't be able to move any of them because the template is locked.
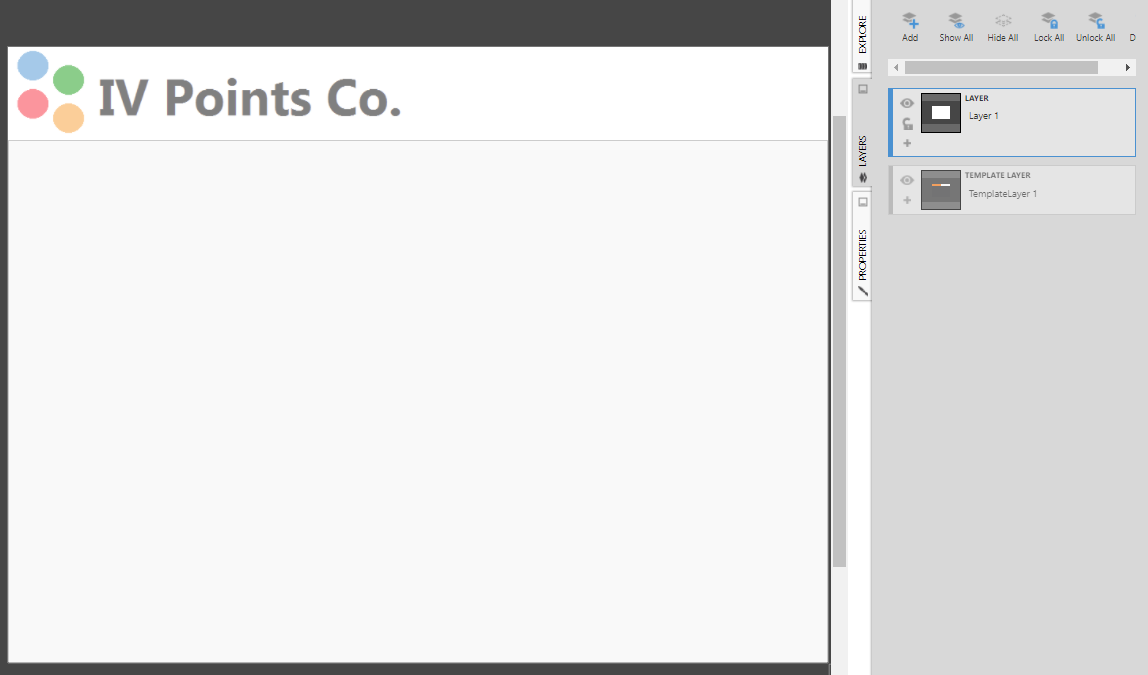
If you open the **Layers** window, you'll see that there is a **template layer** corresponding to the template this dashboard is based upon. It's possible to have more than one template layer if your template has multiple layers. Template layers appear grayed out in the **Layers** window, but you can still show or hide them, or click the plus sign to see the elements within the layer. The lock icon is not available for template layers because they are always locked.
## Using a Template
* You can use a template when you create a new dashboard: select **Views** in the [main menu](/logi-symphony/symphony/v25/navigate/the_symphony_main_menu#thesymphonymain-menu), select **Create** , and then choose a template from the list that includes the templates you created.
* When editing an existing dashboard, select an empty area of the canvas to de-select any elements, select **Template** in the toolbar, and then choose **Use Existing Template**.
The dashboard will show elements from the template grayed out. You won't be able to move any of them because the template is locked.
If you open the **Layers** window, you'll see that there is a **template layer** corresponding to the template this dashboard is based upon. It's possible to have more than one template layer if your template has multiple layers. Template layers appear grayed out in the **Layers** window, but you can still show or hide them, or click the plus sign to see the elements within the layer. The lock icon is not available for template layers because they are always locked.
 **Note:** You cannot reorder template layers in the Layers window. You can, however, reorder regular layers relative to the template layers.
You can add your own content to the dashboard in addition to the template.
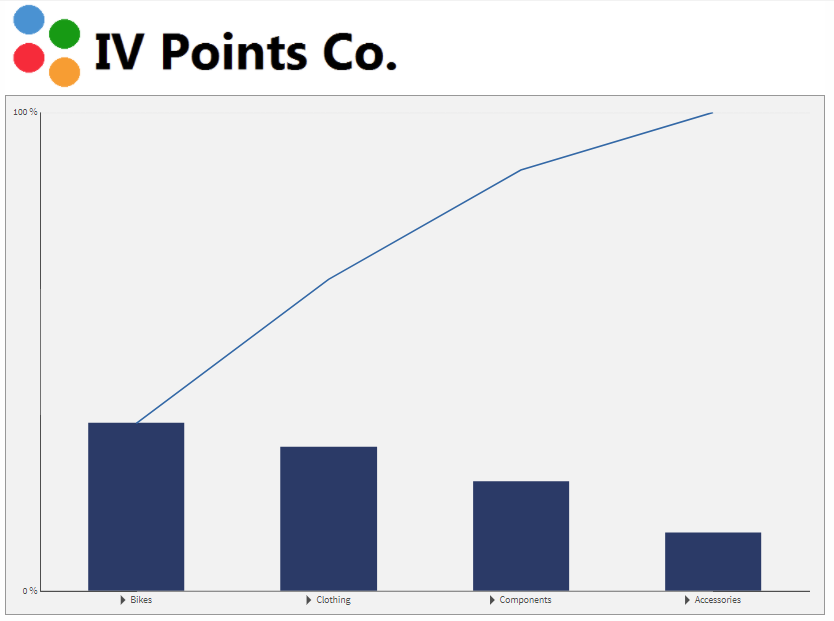
For example, drag a metric set from the **Explore** window and drop it onto the canvas. Then reposition the resulting visualization on top of the background rectangle.
Switch to **View** mode to see the completed dashboard.
**Note:** You cannot reorder template layers in the Layers window. You can, however, reorder regular layers relative to the template layers.
You can add your own content to the dashboard in addition to the template.
For example, drag a metric set from the **Explore** window and drop it onto the canvas. Then reposition the resulting visualization on top of the background rectangle.
Switch to **View** mode to see the completed dashboard.
 ## Detaching a Template
In some situations, you may need to change the template on one dashboard without those changes having an effect on the other dashboards.
With nothing selected on the canvas, click **Template** in the toolbar, then **Detach Template**.
**Note:** The option to **Detach Template** will not be available if there is a conflict of IDs or script names between the template and dashboard. This may happen if you manually changed script names in a conflicting manner.
Unlike when using the **Clear Template** option, all of the elements and settings are carried over from the template to the dashboard. They still appear grayed out and are located in the template layer, but you can now move and edit them.
For more information, see:
* Video: [Dashboard Template](https://www.dundas.com/Support/videos/dashboard-template)
* Layers and Groups
* Using a Template Grid for Resizing
* [Design Overview](/logi-symphony/symphony/v25/available_visual_types/design_overview)
## Detaching a Template
In some situations, you may need to change the template on one dashboard without those changes having an effect on the other dashboards.
With nothing selected on the canvas, click **Template** in the toolbar, then **Detach Template**.
**Note:** The option to **Detach Template** will not be available if there is a conflict of IDs or script names between the template and dashboard. This may happen if you manually changed script names in a conflicting manner.
Unlike when using the **Clear Template** option, all of the elements and settings are carried over from the template to the dashboard. They still appear grayed out and are located in the template layer, but you can now move and edit them.
For more information, see:
* Video: [Dashboard Template](https://www.dundas.com/Support/videos/dashboard-template)
* Layers and Groups
* Using a Template Grid for Resizing
* [Design Overview](/logi-symphony/symphony/v25/available_visual_types/design_overview)