> ## Documentation Index
> Fetch the complete documentation index at: https://insightsoftware-preview.mintlify.site/llms.txt
> Use this file to discover all available pages before exploring further.

# Use The Library For Dashboards

export const InlineImage = ({src, href, alt = "", size = "medium", customSize, position = "left", children}) => {
  const sizeClasses = {
    small: "w-6 h-6",
    medium: "w-8 h-8",
    large: "w-12 h-12",
    xlarge: "w-16 h-16"
  };
  const ImageComponent = () => <img src={src} alt={alt} className={customSize ? '' : sizeClasses[size]} style={{
    verticalAlign: 'baseline',
    display: 'inline-block',
    margin: '0',
    padding: '0',
    border: 'none',
    maxHeight: '1em',
    ...customSize ? {
      width: customSize,
      height: customSize
    } : {
      width: '1em',
      height: '1em'
    }
  }} />;
  const imageElement = href ? <a href={href} className="inline-block border-b-0 no-underline">
            <ImageComponent />
        </a> : <ImageComponent />;
  return <>
            {position === "left" && imageElement}
            {position === "left" && " "}
            {children}
            {position === "right" && " "}
            {position === "right" && imageElement}
        </>;
};

<b>This applies to</b>: *Visual Data Discovery*

The work area of the dashboards tab in library contains all dashboards in your environment to which you have access. You can make a dashboard a favorite, delete it (if your privileges allow), and open the dashboard.

If your user definition has not been given access to dashboards, you will see no dashboards in the dashboards tab in library and you will not be able to import any dashboards. You will be able to create dashboards, but you will not be able to save them. Contact your system administrator to increase your privileges.

## Access the Dashboard Library

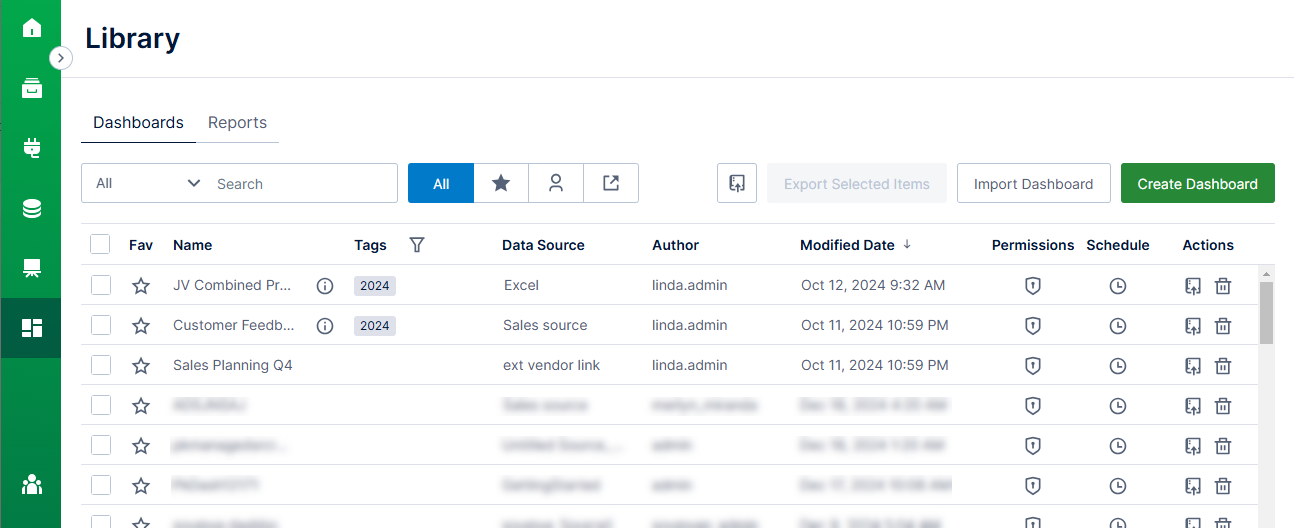
To access the library, select <b>Library</b> on the [UI menu](/logi-symphony/symphony/v24/navigate/the-symphony-main-menu). The library opens to the dashboard tab, and dashboards display in a table (list) format.

<Frame>
  <img src="https://mintcdn.com/insightsoftware-preview/wI6DWZIY-PX6yQHr/images/image_2514.png?fit=max&auto=format&n=wI6DWZIY-PX6yQHr&q=85&s=8b929d56e46119d542233682f8195540" alt="use to manage your dashboards" width="1294" height="528" data-path="images/image_2514.png" />
</Frame>

## Search Field

You can use the search field to filter the dashboards in this work area by dashboard Name, Description (if provided), Data Source, or Author. For example, if you type a <b>C</b> in the search box, only dashboards that include the letter *C* in the selected field searched are shown in the working area. See Search and Filter Lists.

## Buttons

The buttons on the page allow easy access to saved dashboards, as well as other dashboards created by other users in your Symphony environment. They also allow you to create a new dashboard, filter the dashboards that are shown, import, or export dashboards.

<table cellspacing="0" class="TableStyle-GENERIC-TABLESTYLE"><thead><tr class="TableStyle-GENERIC-TABLESTYLE-Head-Header1"><th class="TableStyle-GENERIC-TABLESTYLE-HeadE-Column1-Header1">Button</th><th class="TableStyle-GENERIC-TABLESTYLE-HeadD-Column1-Header1">Description</th></tr></thead><tbody><tr class="TableStyle-GENERIC-TABLESTYLE-Body-Body1"><td class="TableStyle-GENERIC-TABLESTYLE-BodyE-Column1-Body1"><b>All:</b> </td><td class="TableStyle-GENERIC-TABLESTYLE-BodyD-Column1-Body1">Removes any filters for the dashboard library and displays all dashboards available to you within your environment.</td></tr><tr class="TableStyle-GENERIC-TABLESTYLE-Body-Body2"><td class="TableStyle-GENERIC-TABLESTYLE-BodyE-Column1-Body2"><img src="https://mintcdn.com/insightsoftware-preview/dcAFkfQGefV0MZaY/images/dash-favorites.png?fit=max&auto=format&n=dcAFkfQGefV0MZaY&q=85&s=c2a9097de0ebb034542afbaf66db7919" width="32" height="32" data-path="images/dash-favorites.png" /></td><td class="TableStyle-GENERIC-TABLESTYLE-BodyD-Column1-Body2">Displays only the dashboards you have marked as favorites.</td></tr><tr class="TableStyle-GENERIC-TABLESTYLE-Body-Body1"><td class="TableStyle-GENERIC-TABLESTYLE-BodyE-Column1-Body1"><img src="https://mintcdn.com/insightsoftware-preview/8f71Y65TzcTF2nX9/images/sym-my-items.png?fit=max&auto=format&n=8f71Y65TzcTF2nX9&q=85&s=90c1fc42924c4319e6bde9213ba37d27" width="32" height="33" data-path="images/sym-my-items.png" /></td><td class="TableStyle-GENERIC-TABLESTYLE-BodyD-Column1-Body1">Displays only dashboards you created and saved. Dashboards created and saved by other users are hidden.</td></tr><tr class="TableStyle-GENERIC-TABLESTYLE-Body-Body2"><td class="TableStyle-GENERIC-TABLESTYLE-BodyE-Column1-Body2"><img src="https://mintcdn.com/insightsoftware-preview/StJJCeTmWK0u1SbF/images/dash-shared.png?fit=max&auto=format&n=StJJCeTmWK0u1SbF&q=85&s=fd189ed3479dc43f60d6d3cf9b0aa2d7" width="32" height="32" data-path="images/dash-shared.png" /></td><td class="TableStyle-GENERIC-TABLESTYLE-BodyD-Column1-Body2"><p>Displays only the dashboards other users shared with you.</p><p>See Share a Dashboard with Users Inside Your Tenant.</p></td></tr><tr class="TableStyle-GENERIC-TABLESTYLE-Body-Body1"><td class="TableStyle-GENERIC-TABLESTYLE-BodyE-Column1-Body1"><img src="https://mintcdn.com/insightsoftware-preview/dcAFkfQGefV0MZaY/images/dashboard-embed_33x33.png?fit=max&auto=format&n=dcAFkfQGefV0MZaY&q=85&s=49035bd6ce3c9d1427c91fe0a455ca2c" width="33" height="33" data-path="images/dashboard-embed_33x33.png" /></td><td class="TableStyle-GENERIC-TABLESTYLE-BodyD-Column1-Body1">Select to generate an embeddable dashboard link.</td></tr><tr class="TableStyle-GENERIC-TABLESTYLE-Body-Body2"><td class="TableStyle-GENERIC-TABLESTYLE-BodyE-Column1-Body2"><b>Export Selected Items:</b> </td><td class="TableStyle-GENERIC-TABLESTYLE-BodyD-Column1-Body2"><p>Select to export multiple selected items.</p><p>See [Export multiple dashboards ](/logi-symphony/symphony/v24/dashboards/export-dashboards#expmultiple).</p></td></tr><tr class="TableStyle-GENERIC-TABLESTYLE-Body-Body1"><td class="TableStyle-GENERIC-TABLESTYLE-BodyE-Column1-Body1"><b>Import Dashboard:</b> </td><td class="TableStyle-GENERIC-TABLESTYLE-BodyD-Column1-Body1"><p>Select to import one or more dashboards.</p><p>See [Import Dashboards](/logi-symphony/symphony/v24/dashboards/import-dashboards).</p></td></tr><tr class="TableStyle-GENERIC-TABLESTYLE-Body-Body2"><td class="TableStyle-GENERIC-TABLESTYLE-BodyB-Column1-Body2"><b>Create Dashboard:</b> </td><td class="TableStyle-GENERIC-TABLESTYLE-BodyA-Column1-Body2"><p>Select to create a new dashboard.</p><p>See [Create Dashboards](/logi-symphony/symphony/v24/dashboards/create-dashboards).</p></td></tr></tbody></table>

## List of Dashboards

The columns for this list are described below. Several of these columns can be used to sort the contents of the list: select the column header to sort first to last and again to sort last to first. You can search for items by the contents of several columns. See Search and Filter Lists.

<table cellspacing="0" class="TableStyle-GENERIC-TABLESTYLE"><thead><tr class="TableStyle-GENERIC-TABLESTYLE-Head-Header1"><th class="TableStyle-GENERIC-TABLESTYLE-HeadE-Column1-Header1">Column</th><th class="TableStyle-GENERIC-TABLESTYLE-HeadD-Column1-Header1">Description</th></tr></thead><tbody><tr class="TableStyle-GENERIC-TABLESTYLE-Body-Body1"><td class="TableStyle-GENERIC-TABLESTYLE-BodyE-Column1-Body1">Select (not labeled)</td><td class="TableStyle-GENERIC-TABLESTYLE-BodyD-Column1-Body1">Select or deselect one or more items to perform bulk actions, such as export, for your content.</td></tr><tr class="TableStyle-GENERIC-TABLESTYLE-Body-Body2"><td class="TableStyle-GENERIC-TABLESTYLE-BodyE-Column1-Body2">Fav</td><td class="TableStyle-GENERIC-TABLESTYLE-BodyD-Column1-Body2">Identifies favorite dashboards using a star icon. If the star is colored ( <InlineImage src="/images/dash-favorites.png" />), the dashboard is a favorite. If the star is empty ( <InlineImage src="/images/star-open.png" />), the dashboard is not a favorite. If you change the favorite status of a dashboard while viewing or editing it, that change is reflected here.</td></tr><tr class="TableStyle-GENERIC-TABLESTYLE-Body-Body1"><td class="TableStyle-GENERIC-TABLESTYLE-BodyE-Column1-Body1">Name</td><td class="TableStyle-GENERIC-TABLESTYLE-BodyD-Column1-Body1">The name of the dashboard.</td></tr><tr class="TableStyle-GENERIC-TABLESTYLE-Body-Body2"><td class="TableStyle-GENERIC-TABLESTYLE-BodyE-Column1-Body2">Description (not labeled)</td><td class="TableStyle-GENERIC-TABLESTYLE-BodyD-Column1-Body2">The description icon is visible if a description associated with a dashboard. You can search for a dashboard by the contents of this field.</td></tr><tr class="TableStyle-GENERIC-TABLESTYLE-Body-Body1"><td class="TableStyle-GENERIC-TABLESTYLE-BodyE-Column1-Body1">Tags</td><td class="TableStyle-GENERIC-TABLESTYLE-BodyD-Column1-Body1">Content tags applied to the dashboard. Select the filter icon to open a drop down list and select tags to filter your list or to narrow your search results. If several tags are associated with an item, hover over the ellipsis to see all tags for this resource.</td></tr><tr class="TableStyle-GENERIC-TABLESTYLE-Body-Body2"><td class="TableStyle-GENERIC-TABLESTYLE-BodyE-Column1-Body2">Filter icon</td><td class="TableStyle-GENERIC-TABLESTYLE-BodyD-Column1-Body2">Select to filter the work area's contents by one or more content tags.</td></tr><tr class="TableStyle-GENERIC-TABLESTYLE-Body-Body1"><td class="TableStyle-GENERIC-TABLESTYLE-BodyE-Column1-Body1">Data Source</td><td class="TableStyle-GENERIC-TABLESTYLE-BodyD-Column1-Body1">The name of the data sources used by the dashboard.</td></tr><tr class="TableStyle-GENERIC-TABLESTYLE-Body-Body2"><td class="TableStyle-GENERIC-TABLESTYLE-BodyE-Column1-Body2">Author</td><td class="TableStyle-GENERIC-TABLESTYLE-BodyD-Column1-Body2">The user who created the dashboard.</td></tr><tr class="TableStyle-GENERIC-TABLESTYLE-Body-Body1"><td class="TableStyle-GENERIC-TABLESTYLE-BodyE-Column1-Body1">Modified Date</td><td class="TableStyle-GENERIC-TABLESTYLE-BodyD-Column1-Body1">The date the dashboard was last modified.</td></tr><tr class="TableStyle-GENERIC-TABLESTYLE-Body-Body2"><td class="TableStyle-GENERIC-TABLESTYLE-BodyE-Column1-Body2">Permissions</td><td class="TableStyle-GENERIC-TABLESTYLE-BodyD-Column1-Body2"><p>Select the permissions icon in this column to assign permissions to a dashboard. The Dashboard Permissions dialog appears.</p><p>See About Dashboard Permissions.</p></td></tr><tr class="TableStyle-GENERIC-TABLESTYLE-Body-Body1"><td class="TableStyle-GENERIC-TABLESTYLE-BodyE-Column1-Body1">Schedule</td><td class="TableStyle-GENERIC-TABLESTYLE-BodyD-Column1-Body1"><p>Select the clock ( <InlineImage src="/images/dashboard-schedule.png" />) in this column to create a scheduled dashboard report for the dashboard. The Scheduled Reports dialog appears.</p><p>See About Scheduled Dashboard ReportsAbout Scheduled Data Discovery Dashboard Reports.</p></td></tr><tr class="TableStyle-GENERIC-TABLESTYLE-Body-Body2"><td class="TableStyle-GENERIC-TABLESTYLE-BodyB-Column1-Body2">Actions</td><td class="TableStyle-GENERIC-TABLESTYLE-BodyA-Column1-Body2"><p>Shows icons you can select to perform actions for the dashboard.</p><ul><li><p>Select the delete icon ( <InlineImage src="/images/trashcan.png" />) in this column to delete a dashboard. See Delete a Dashboard. </p></li><li><p>Select the code snippet icon ( <InlineImage src="/images/dashboard-embed.png" />) icon to generate an embeddable code snippet for the dashboard. The Embed Code dialog appears. See Embed Components Into Your Application.</p></li></ul></td></tr></tbody></table>
