> ## Documentation Index
> Fetch the complete documentation index at: https://insightsoftware-preview.mintlify.site/llms.txt
> Use this file to discover all available pages before exploring further.
# Use A Dashboard In A Report
export const InlineImage = ({src, href, alt = "", size = "medium", customSize, position = "left", children}) => {
const sizeClasses = {
small: "w-6 h-6",
medium: "w-8 h-8",
large: "w-12 h-12",
xlarge: "w-16 h-16"
};
const ImageComponent = () =>  ;
const imageElement = href ?
: ;
return <>
{position === "left" && imageElement}
{position === "left" && " "}
{children}
{position === "right" && " "}
{position === "right" && imageElement}
;
};
This applies to: *Managed Dashboards, Managed Reports*
You can use an existing view such as a dashboard in your report, scorecard, or small multiple.
Reports, scorecards, and small multiples are able to repeat the same view multiple times, each for a different parameter value. You might also use a report to format multiple dashboards into pages that can be exported to PDF.
## Example Dashboard
In this example, we will use *My First Dashboard* from the *Getting Started project*.
Open your instance and switch to the *Getting Started* project.
;
const imageElement = href ?
: ;
return <>
{position === "left" && imageElement}
{position === "left" && " "}
{children}
{position === "right" && " "}
{position === "right" && imageElement}
;
};
This applies to: *Managed Dashboards, Managed Reports*
You can use an existing view such as a dashboard in your report, scorecard, or small multiple.
Reports, scorecards, and small multiples are able to repeat the same view multiple times, each for a different parameter value. You might also use a report to format multiple dashboards into pages that can be exported to PDF.
## Example Dashboard
In this example, we will use *My First Dashboard* from the *Getting Started project*.
Open your instance and switch to the *Getting Started* project.
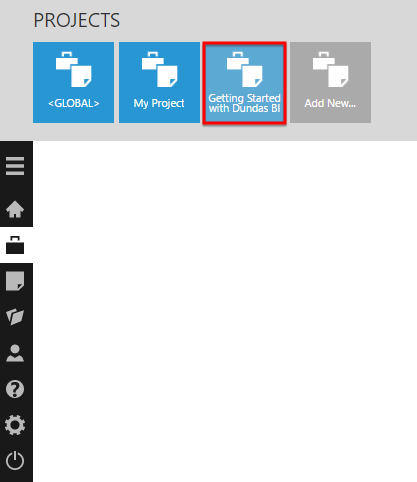 *My first dashboard* is found in this project.
## Repeating a Dashboard
From the main menu, click New and select Report, for example, to create a new report. The steps are similar for scorecards and small multiples.
In the Explore window, locate the *Product Sales data* cube and drag *Product* onto the grouping drop area (drop data here...).
Symphony automatically creates a data label and header for the grouping hierarchy, which are optional and you can delete them if preferred.
*My first dashboard* is found in this project.
## Repeating a Dashboard
From the main menu, click New and select Report, for example, to create a new report. The steps are similar for scorecards and small multiples.
In the Explore window, locate the *Product Sales data* cube and drag *Product* onto the grouping drop area (drop data here...).
Symphony automatically creates a data label and header for the grouping hierarchy, which are optional and you can delete them if preferred.
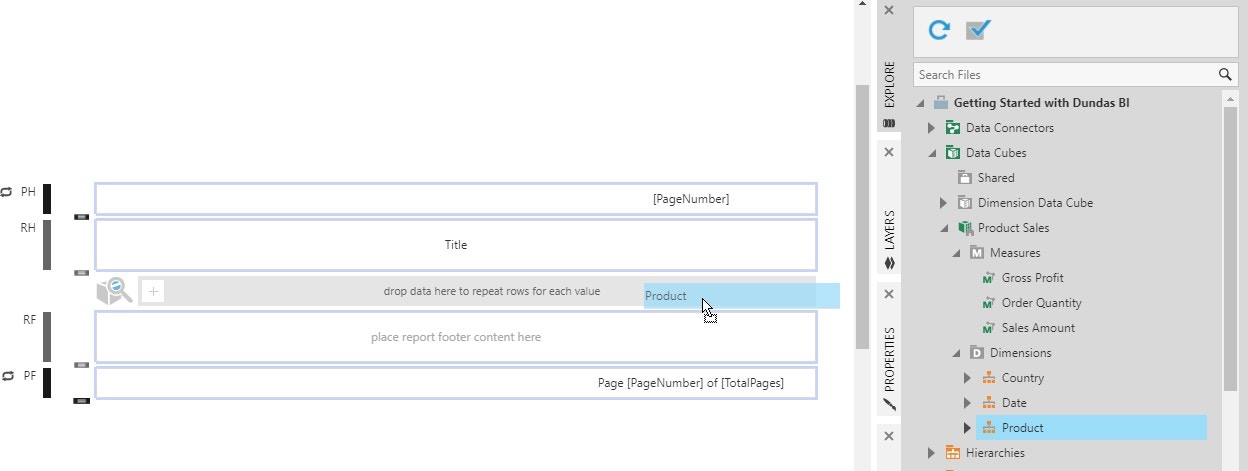 Locate *My first dashboard* and drag it onto the Group Body region. Resize it as needed to fit the dashboard.
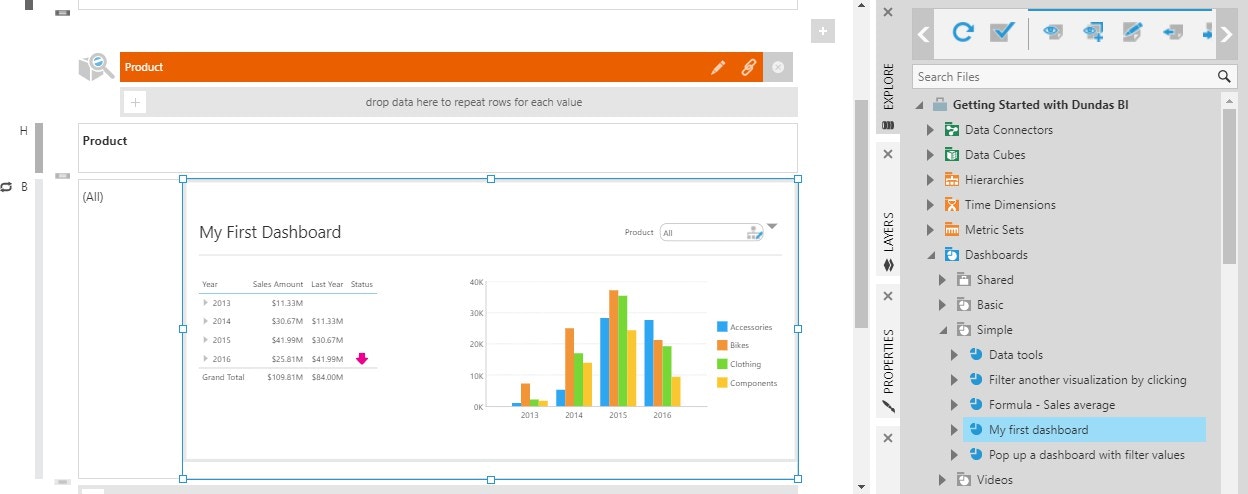 With the dashboard selected, open the Properties window.
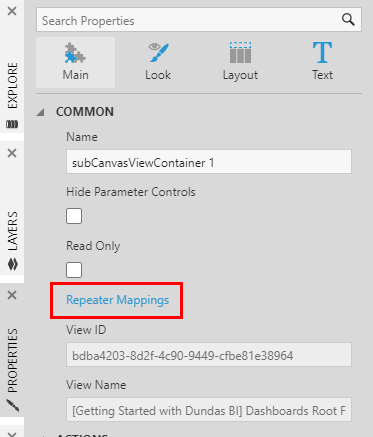
Click Repeater Mappings.
With the dashboard selected, open the Properties window.
Click Repeater Mappings.
 In the *Set Up Parameter* Mappings dialog, click Add new mapping.
Select Product (Filter Value) under Repeater Group and Product under *My First Dashboard*.
In the *Set Up Parameter* Mappings dialog, click Add new mapping.
Select Product (Filter Value) under Repeater Group and Product under *My First Dashboard*.
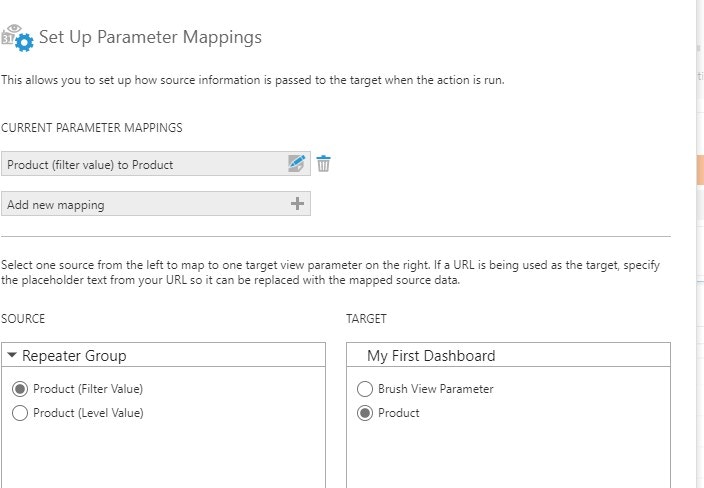 Click the Submit button at the bottom of the dialog, and switch to [View mode](/logi-symphony/symphony/v24/dashboards/edit-versus-view-mode-and-sandbox-view).
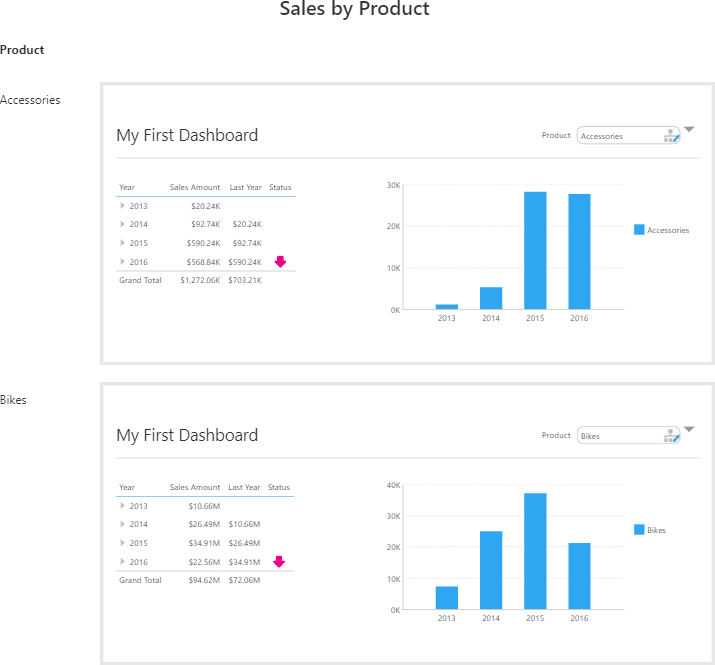 With the repeater mappings set up, each copy of the dashboard is filtered to a single product category in our example: each bar chart has only a single series, and the filter above it shows the corresponding product category.
When the view contains filters that you don't want displayed while embedded inside of another view, you can go to the Properties window with the view selected in edit mode, and enable the Hide Parameter Controls option.
## Exporting Dashboards
Rather than repeat a dashboard or view multiple times, you can also use a report to format dashboards or other views into pages to be exported into a single PDF, which can then be shared or saved, delivered by e-mail, or printed.
You don't necessarily need to drag data to repeat any content in your report, and can simply drag views such as dashboards to the Report Footer region, for example.
To add additional template regions, select a region such as the Report Footer. If the region already contains content, you can click the area labeled RF
or similar on the left, or select content inside the region and click Select Template Cell.
With the repeater mappings set up, each copy of the dashboard is filtered to a single product category in our example: each bar chart has only a single series, and the filter above it shows the corresponding product category.
When the view contains filters that you don't want displayed while embedded inside of another view, you can go to the Properties window with the view selected in edit mode, and enable the Hide Parameter Controls option.
## Exporting Dashboards
Rather than repeat a dashboard or view multiple times, you can also use a report to format dashboards or other views into pages to be exported into a single PDF, which can then be shared or saved, delivered by e-mail, or printed.
You don't necessarily need to drag data to repeat any content in your report, and can simply drag views such as dashboards to the Report Footer region, for example.
To add additional template regions, select a region such as the Report Footer. If the region already contains content, you can click the area labeled RF
or similar on the left, or select content inside the region and click Select Template Cell.
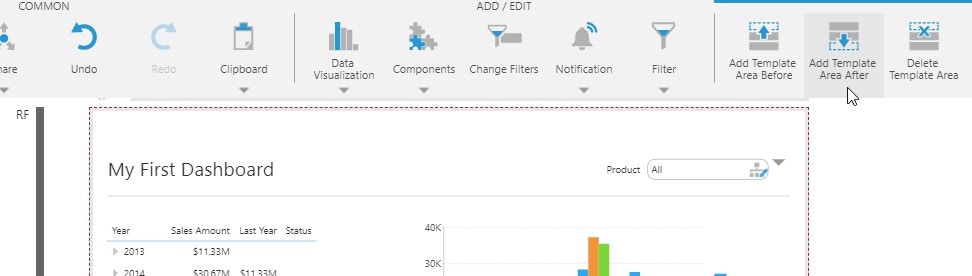 Click Add Template Area After or Add Template Area Before in the toolbar, then drag another view into the new region.
For more information, see:
* Symphony Managed Reports
* Symphony Scorecards
* Create Small Multiples
* Using a View Container
* Filter Child Dashboards From a Parent Dashboard
* Design Tips for Reports and Scorecards
Click Add Template Area After or Add Template Area Before in the toolbar, then drag another view into the new region.
For more information, see:
* Symphony Managed Reports
* Symphony Scorecards
* Create Small Multiples
* Using a View Container
* Filter Child Dashboards From a Parent Dashboard
* Design Tips for Reports and Scorecards