> ## Documentation Index
> Fetch the complete documentation index at: https://insightsoftware-preview.mintlify.site/llms.txt
> Use this file to discover all available pages before exploring further.
# Select And Group Data For A Metric Set
export const InlineImage = ({src, href, alt = "", size = "medium", customSize, position = "left", children}) => {
const sizeClasses = {
small: "w-6 h-6",
medium: "w-8 h-8",
large: "w-12 h-12",
xlarge: "w-16 h-16"
};
const ImageComponent = () =>  ;
const imageElement = href ?
: ;
return <>
{position === "left" && imageElement}
{position === "left" && " "}
{children}
{position === "right" && " "}
{position === "right" && imageElement}
;
};
This applies to: *Managed Dashboards, Managed Reports*
This topic provides links to topics related to selecting and grouping data.
## New Metric Set
1. To create a metric set in the full-screen editor, select Business in the [main menu](/logi-symphony/symphony/v24/navigate/the-symphony-main-menu), then Metric Set.
2. Start by choosing your first data source. a wide variety of security and permissions
;
const imageElement = href ?
: ;
return <>
{position === "left" && imageElement}
{position === "left" && " "}
{children}
{position === "right" && " "}
{position === "right" && imageElement}
;
};
This applies to: *Managed Dashboards, Managed Reports*
This topic provides links to topics related to selecting and grouping data.
## New Metric Set
1. To create a metric set in the full-screen editor, select Business in the [main menu](/logi-symphony/symphony/v24/navigate/the-symphony-main-menu), then Metric Set.
2. Start by choosing your first data source. a wide variety of security and permissions
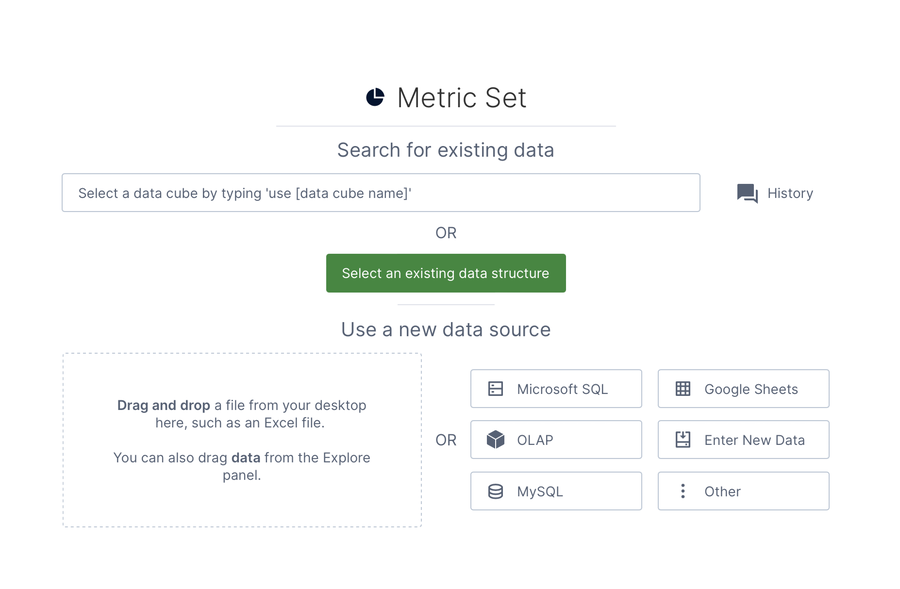 This can be any data found under a data connector or data cube someone has already added to Symphony, or a file from your computer like a spreadsheet.
3. Drag it onto the canvas, or choose Use an existing data structure to locate it in Symphony.
4. A table visualization now displays whatever data you chose with the *Data Analysis Panel* to the left.
Note: Create and edit metric sets directly on a dashboard or other view by dragging data onto its canvas, then using the same Data Analysis Panel.
## Adding More Data
The Data Analysis Panel is central to choosing and analyzing data. Regardless of which visualization you use, you can group and filter your data by placing it under one of these same four options:
* Measures : numeric values that can be grouped and filtered
* Rows : group by this data into a row for each value
* Slicers : filter the data by the selected values
* Columns: group by this data into a column for each value
You can find more details and examples in Slicers versus columns and rows.
To see more data, drag it from the Explore window, or you can click to add more data from your current data source.
This can be any data found under a data connector or data cube someone has already added to Symphony, or a file from your computer like a spreadsheet.
3. Drag it onto the canvas, or choose Use an existing data structure to locate it in Symphony.
4. A table visualization now displays whatever data you chose with the *Data Analysis Panel* to the left.
Note: Create and edit metric sets directly on a dashboard or other view by dragging data onto its canvas, then using the same Data Analysis Panel.
## Adding More Data
The Data Analysis Panel is central to choosing and analyzing data. Regardless of which visualization you use, you can group and filter your data by placing it under one of these same four options:
* Measures : numeric values that can be grouped and filtered
* Rows : group by this data into a row for each value
* Slicers : filter the data by the selected values
* Columns: group by this data into a column for each value
You can find more details and examples in Slicers versus columns and rows.
To see more data, drag it from the Explore window, or you can click to add more data from your current data source.
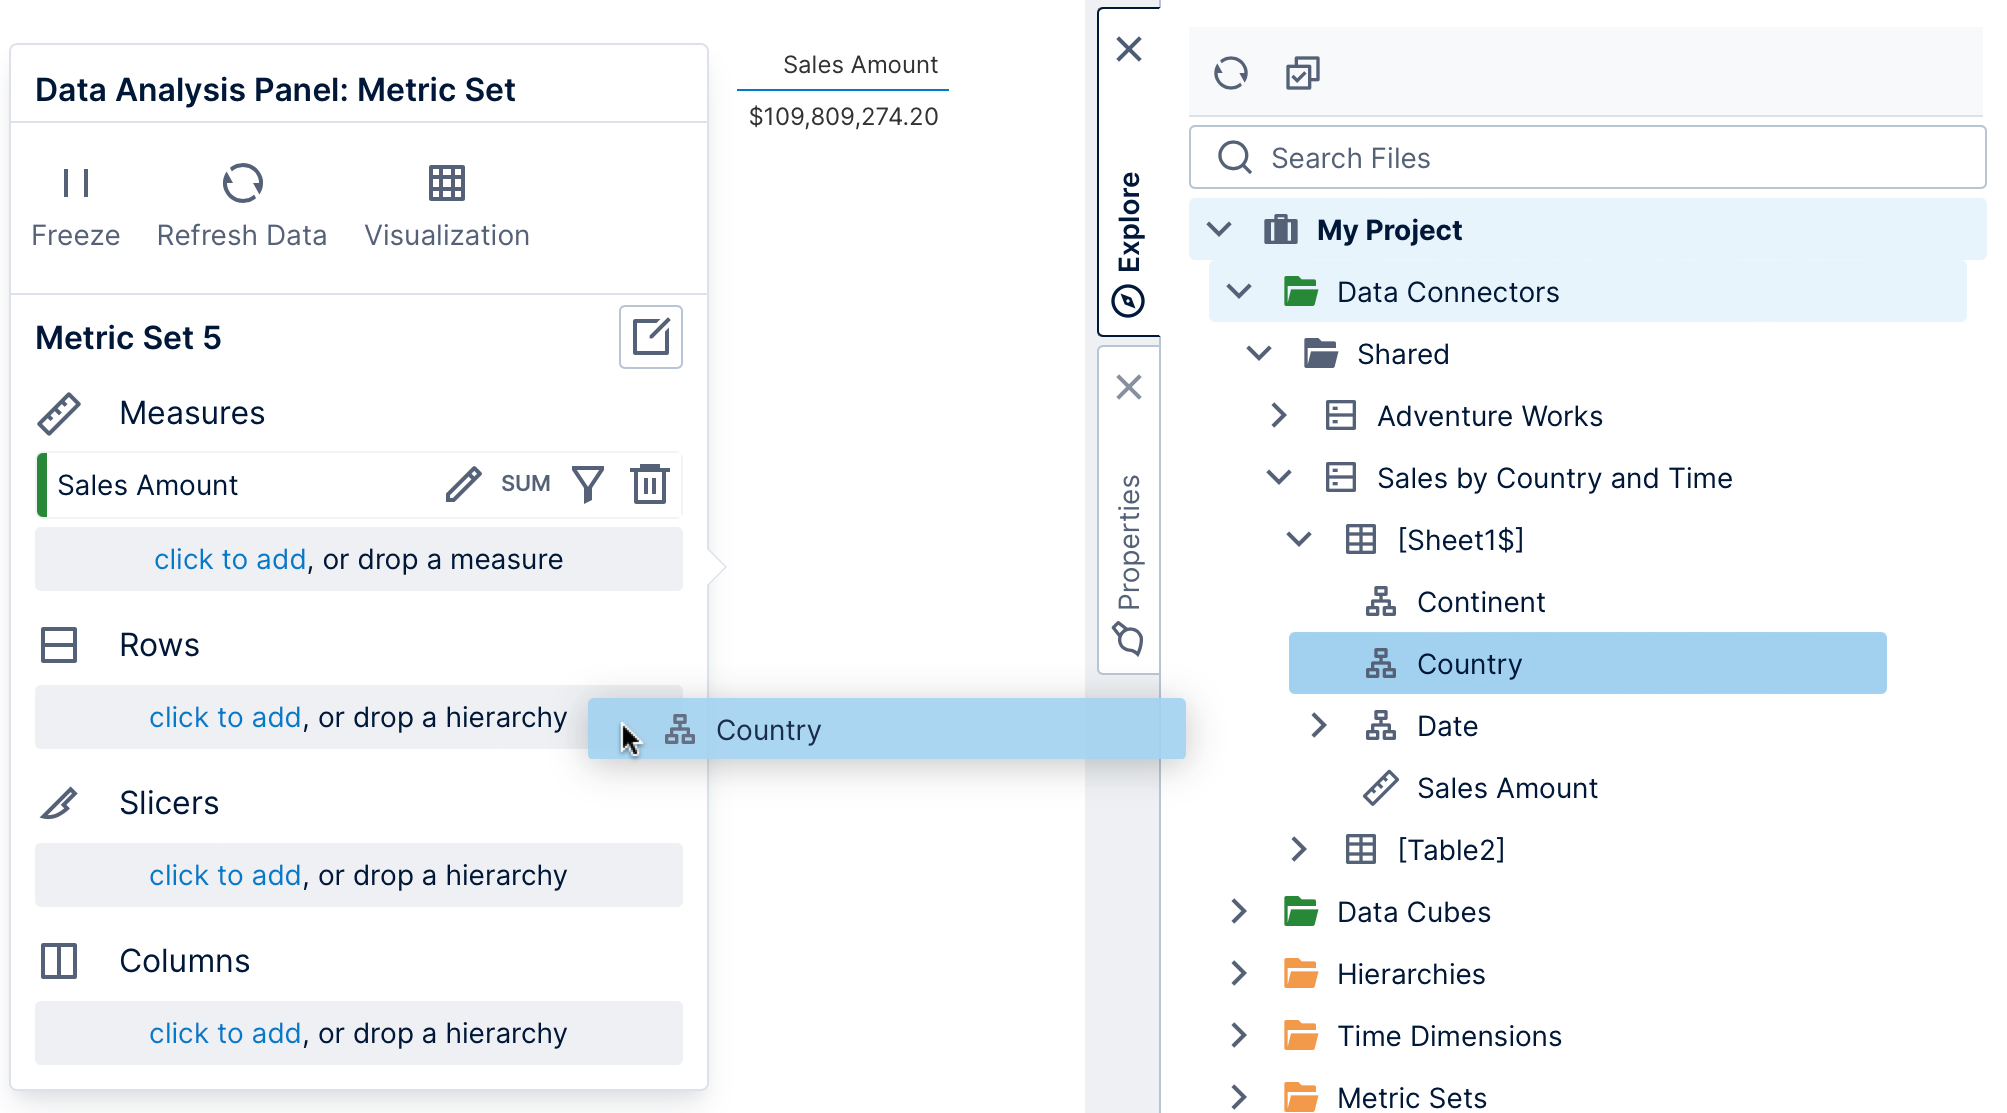 Note: In the Explore window, different icons indicate whether data is has been categorized as a measure (numeric data) or a hierarchy (usually non-numeric data). If you are working with data from a data connector directly, you can use numeric data as either a measure or hierarchy regardless, or you can right-click and choose Change Category: to switch between them. (Database primary keys with key icons are typically numeric but used as hierarchies.)
When dragging, you can drop data directly where you want it in the Data Analysis Panel, or onto the blue highlighted area of the visualization if you're not sure where to drop it. In a full screen metric set, you can also access the Assistant from the toolbar and type what you want to see.
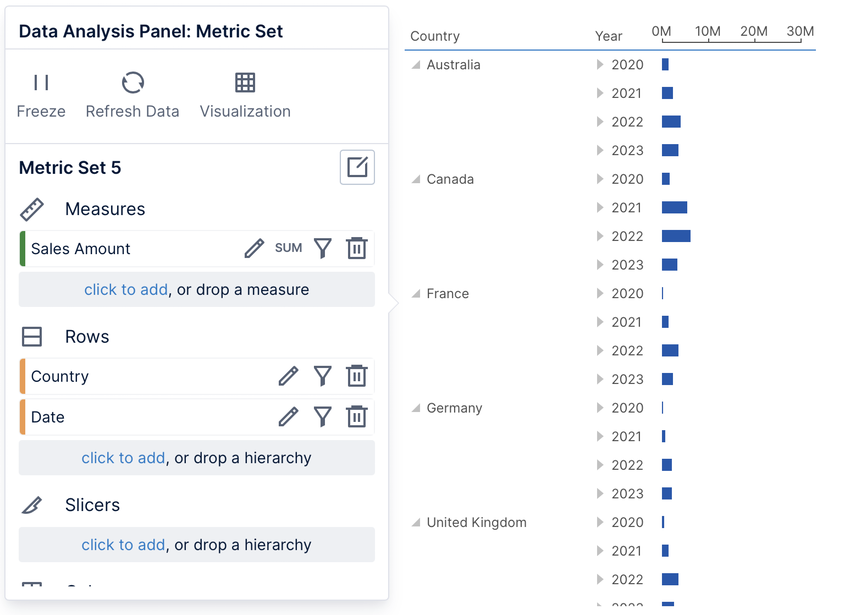
By placing data on Rows or Columns , you are grouping by those values in the order they are placed. For example, place a time dimension hierarchy on Rows to see sales numbers grouped by year, even if the data source contains many rows for individual dates.
Note: In the Explore window, different icons indicate whether data is has been categorized as a measure (numeric data) or a hierarchy (usually non-numeric data). If you are working with data from a data connector directly, you can use numeric data as either a measure or hierarchy regardless, or you can right-click and choose Change Category: to switch between them. (Database primary keys with key icons are typically numeric but used as hierarchies.)
When dragging, you can drop data directly where you want it in the Data Analysis Panel, or onto the blue highlighted area of the visualization if you're not sure where to drop it. In a full screen metric set, you can also access the Assistant from the toolbar and type what you want to see.
By placing data on Rows or Columns , you are grouping by those values in the order they are placed. For example, place a time dimension hierarchy on Rows to see sales numbers grouped by year, even if the data source contains many rows for individual dates.
 Note: You can drag data from another table or data source in the Explore window and it will be automatically joined. This uses database relationships for tables from the same database, or relationships for different data sources.
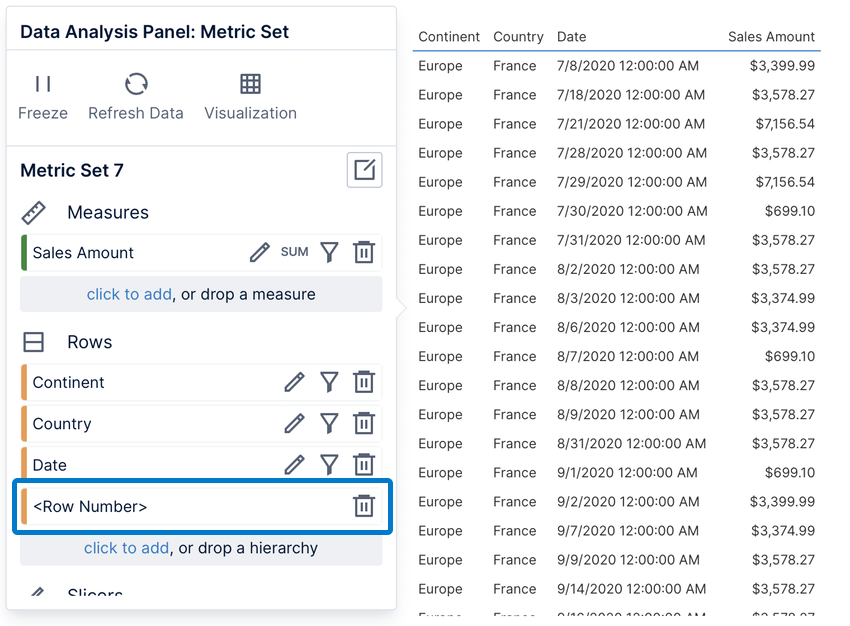
If you click to add the special option \< Row Number>, the data will not be grouped and all original rows will be displayed unaggregated and unsorted as raw data. There are various limitations with raw data mode, but in return this allows you to view the underlying data unmodified. This option is also initially selected when you select or drag an entire table or spreadsheet as the data for your metric set.
Note: You can drag data from another table or data source in the Explore window and it will be automatically joined. This uses database relationships for tables from the same database, or relationships for different data sources.
If you click to add the special option \< Row Number>, the data will not be grouped and all original rows will be displayed unaggregated and unsorted as raw data. There are various limitations with raw data mode, but in return this allows you to view the underlying data unmodified. This option is also initially selected when you select or drag an entire table or spreadsheet as the data for your metric set.