> ## Documentation Index
> Fetch the complete documentation index at: https://insightsoftware-preview.mintlify.site/llms.txt
> Use this file to discover all available pages before exploring further.

# Waterfall

export const InlineImage = ({src, href, alt = "", size = "medium", customSize, position = "left", children}) => {
  const sizeClasses = {
    small: "w-6 h-6",
    medium: "w-8 h-8",
    large: "w-12 h-12",
    xlarge: "w-16 h-16"
  };
  const ImageComponent = () => <img src={src} alt={alt} className={customSize ? '' : sizeClasses[size]} style={{
    verticalAlign: 'baseline',
    display: 'inline-block',
    margin: '0',
    padding: '0',
    border: 'none',
    maxHeight: '1em',
    ...customSize ? {
      width: customSize,
      height: customSize
    } : {
      width: '1em',
      height: '1em'
    }
  }} />;
  const imageElement = href ? <a href={href} className="inline-block border-b-0 no-underline">
            <ImageComponent />
        </a> : <ImageComponent />;
  return <>
            {position === "left" && imageElement}
            {position === "left" && " "}
            {children}
            {position === "right" && " "}
            {position === "right" && imageElement}
        </>;
};

<b>This applies to</b> : *Visual Data Discovery*

Waterfall visuals are based on at least one time attribute and one or multiple metrics, and can incorporate positive and negative values. You can include a reference line, grid lines, and a Totals bar. Waterfall visuals with multiple metrics are supported by all Symphony [data connectors.](/logi-symphony/symphony/v24/navigate/data-connector-reference)

This topic describes:

* Configure Settings for a Waterfall Visual
* Configure Colors for a Waterfall Visual
* Multiple Metrics in a Waterfall Visual

For information on setting even time intervals, see *Even Time Intervals*.

## Configure Settings for a Waterfall Visual

<b>Change the settings for a waterfall visual</b>

1. Edit the waterfall visual you want to modify. See *Edit Visuals*.

2. If you are editing the visual in a dashboard, select <b>Settings</b> from the visual drop-down menu. The sidebar menu for the visual appears.

If you are editing the visual from the Visual Gallery, the sidebar appears to the right of the visual.

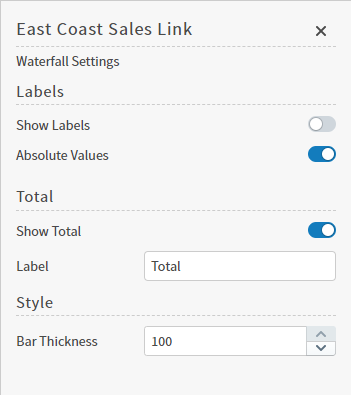
3. Select the settings icon ( <InlineImage src="/images/image_1258.png" alt="" />) on the sidebar menu. The Waterfall Settings sidebar for the visual appears.

<Frame>
  <img src="https://mintcdn.com/insightsoftware-preview/vrCSq4zjYJiUEBhY/images/image_9115.png?fit=max&auto=format&n=vrCSq4zjYJiUEBhY&q=85&s=13bff78f335ea8b3ae36a053cb1d187d" alt="use this menu to change the settings fo ryour waterfall visual" width="351" height="395" data-path="images/image_9115.png" />
</Frame>

4. Alter the settings as needed:

<table cellspacing="0" class="TableStyle-GENERIC-TABLESTYLE"><thead><tr class="TableStyle-GENERIC-TABLESTYLE-Head-Header1"><th class="TableStyle-GENERIC-TABLESTYLE-HeadE-Column1-Header1">Setting</th><th class="TableStyle-GENERIC-TABLESTYLE-HeadD-Column1-Header1">Description</th></tr></thead><tbody><tr class="TableStyle-GENERIC-TABLESTYLE-Body-Body1"><td class="TableStyle-GENERIC-TABLESTYLE-BodyE-Column1-Body1">Show Labels</td><td class="TableStyle-GENERIC-TABLESTYLE-BodyD-Column1-Body1">Enable to show the field names as labels in the visual. Disable to hide the field names.</td></tr><tr class="TableStyle-GENERIC-TABLESTYLE-Body-Body2"><td class="TableStyle-GENERIC-TABLESTYLE-BodyE-Column1-Body2">Absolute Value</td><td class="TableStyle-GENERIC-TABLESTYLE-BodyD-Column1-Body2">Enable to show the absolute value represented by each waterfall bar. Disable to hide the absolute value.</td></tr><tr class="TableStyle-GENERIC-TABLESTYLE-Body-Body1"><td class="TableStyle-GENERIC-TABLESTYLE-BodyE-Column1-Body1">Show Total</td><td class="TableStyle-GENERIC-TABLESTYLE-BodyD-Column1-Body1">Enable to show a total representation of all information included in the waterfall bars.</td></tr><tr class="TableStyle-GENERIC-TABLESTYLE-Body-Body2"><td class="TableStyle-GENERIC-TABLESTYLE-BodyE-Column1-Body2">Label</td><td class="TableStyle-GENERIC-TABLESTYLE-BodyD-Column1-Body2">By default, the Label for total is Total; change as needed.</td></tr><tr class="TableStyle-GENERIC-TABLESTYLE-Body-Body1"><td class="TableStyle-GENERIC-TABLESTYLE-BodyB-Column1-Body1">Bar Thickness</td><td class="TableStyle-GENERIC-TABLESTYLE-BodyA-Column1-Body1">Adjust the thickness of the bars in your visual as needed.</td></tr></tbody></table>
5\. Optionally, edit the number or date and time format for this visual. See *Configure Number Formatting for Visuals* and *Configure Date and Time Formatting for Visuals*.

6. Select the save icon (<InlineImage src="/images/image_622.png" alt="" />) to save the visual, or dashboard and the visual with updated settings.

## Configure Colors for a Waterfall Visual

<b>Specify the color settings for a Waterfall Visual using the Color sidebar</b>

1. Edit the visual you want to modify. See *Edit Visuals*.

2. If you are editing the visual in a dashboard, select <b>Settings</b> from the visual drop-down menu. The sidebar menu for the visual appears. If you are editing the visual from the Visual Gallery, the sidebar appears to the right of the visual.

Select <InlineImage src="/images/image_1356.png" alt="" /> on the sidebar menu. The Color sidebar for the visual appears.

3. Configure the color settings as described below. As you change the color settings, the legend at the top of the Color sidebar shows how the legend will appear on the visual. Supported color specifications are described in *Specifying Colors*.

<table cellspacing="0" class="TableStyle-GENERIC-TABLESTYLE"><thead><tr class="TableStyle-GENERIC-TABLESTYLE-Head-Header1"><th class="TableStyle-GENERIC-TABLESTYLE-HeadE-Column1-Header1">Setting</th><th class="TableStyle-GENERIC-TABLESTYLE-HeadD-Column1-Header1">Description</th></tr></thead><tbody><tr class="TableStyle-GENERIC-TABLESTYLE-Body-Body1"><td class="TableStyle-GENERIC-TABLESTYLE-BodyE-Column1-Body1">Legend</td><td class="TableStyle-GENERIC-TABLESTYLE-BodyD-Column1-Body1"><p>Enable or disable to display a dynamic legend in this visual. Dynamic legends allow you to temporarily add or remove data shown in the visual. </p><ul><li>For distinct color styles, select a data point in the legend to turn it off and on in the visual. </li><li>For gradient color styles, use the legend’s gradient slider to show and hide your data. </li><li>Use the color selector to manually assign colors for legend items.</li></ul><p>If available, enable or disable a static legend for this visual.</p></td></tr><tr class="TableStyle-GENERIC-TABLESTYLE-Body-Body2"><td class="TableStyle-GENERIC-TABLESTYLE-BodyE-Column1-Body2">Color </td><td class="TableStyle-GENERIC-TABLESTYLE-BodyD-Column1-Body2"><p>Manually select the colors for each metric using the color selector. Visuals that incorporate positive and negative values displays color options paired as <b>\<field>:</b> and <b>\<field> (Negative):</b>. Options include</p><ul><li>Select individual colors to choose a custom color for any or all metrics. Custom colors are listed by metric in the <b>Assigned Colors:</b> work area.</li><li>Select <b>Reset Colors:</b> in the Assigned Colors work area to revert your colors to their previous saved state.</li></ul></td></tr><tr class="TableStyle-GENERIC-TABLESTYLE-Body-Body1"><td class="TableStyle-GENERIC-TABLESTYLE-BodyE-Column1-Body1">Total Color</td><td class="TableStyle-GENERIC-TABLESTYLE-BodyD-Column1-Body1">Manually select a color for the Total using the color selector, or select the <b>Inherit from theme:</b> checkbox to use the color palette specified by the theme.</td></tr><tr class="TableStyle-GENERIC-TABLESTYLE-Body-Body2"><td class="TableStyle-GENERIC-TABLESTYLE-BodyB-Column1-Body2">\<type> Color Palette</td><td class="TableStyle-GENERIC-TABLESTYLE-BodyA-Column1-Body2"><p>Select a color palette for this specific visual. </p><p>Select the <b>Inherit from theme:</b> checkbox to use the color palette specified by the theme.</p></td></tr></tbody></table>
4\. Close the Color sidebar and the color settings are dynamically applied to the visual.

5. Select <InlineImage src="/images/image_622.png" alt="" /> to save the dashboard and the visual with its updated settings.

## Multiple Metrics in a Waterfall Visual

If you use multiple metrics in your waterfall visual, you can control the order in which the metrics appear in the waterfall. Add one or more metrics to the Y axis in the order you'd like them to appear. The first one you add will be the left most metric, and subsequent metrics will appear to the right of existing metrics.
