> ## Documentation Index
> Fetch the complete documentation index at: https://insightsoftware-preview.mintlify.site/llms.txt
> Use this file to discover all available pages before exploring further.

# Home Page

export const InlineImage = ({src, href, alt = "", size = "medium", customSize, position = "left", children}) => {
  const sizeClasses = {
    small: "w-6 h-6",
    medium: "w-8 h-8",
    large: "w-12 h-12",
    xlarge: "w-16 h-16"
  };
  const ImageComponent = () => <img src={src} alt={alt} className={customSize ? '' : sizeClasses[size]} style={{
    verticalAlign: 'baseline',
    display: 'inline-block',
    margin: '0',
    padding: '0',
    border: 'none',
    maxHeight: '1em',
    ...customSize ? {
      width: customSize,
      height: customSize
    } : {
      width: '1em',
      height: '1em'
    }
  }} />;
  const imageElement = href ? <a href={href} className="inline-block border-b-0 no-underline">
            <ImageComponent />
        </a> : <ImageComponent />;
  return <>
            {position === "left" && imageElement}
            {position === "left" && " "}
            {children}
            {position === "right" && " "}
            {position === "right" && imageElement}
        </>;
};

When you [log in](/logi-symphony/composer/v24/navigate/log-into-the-composer-ui), the Composer home page opens. Explore and interact with your Composer environment, including its dashboards, visuals, and visualizations in a variety of ways.

This topic covers the different options and features available to you.

## View the Home Page

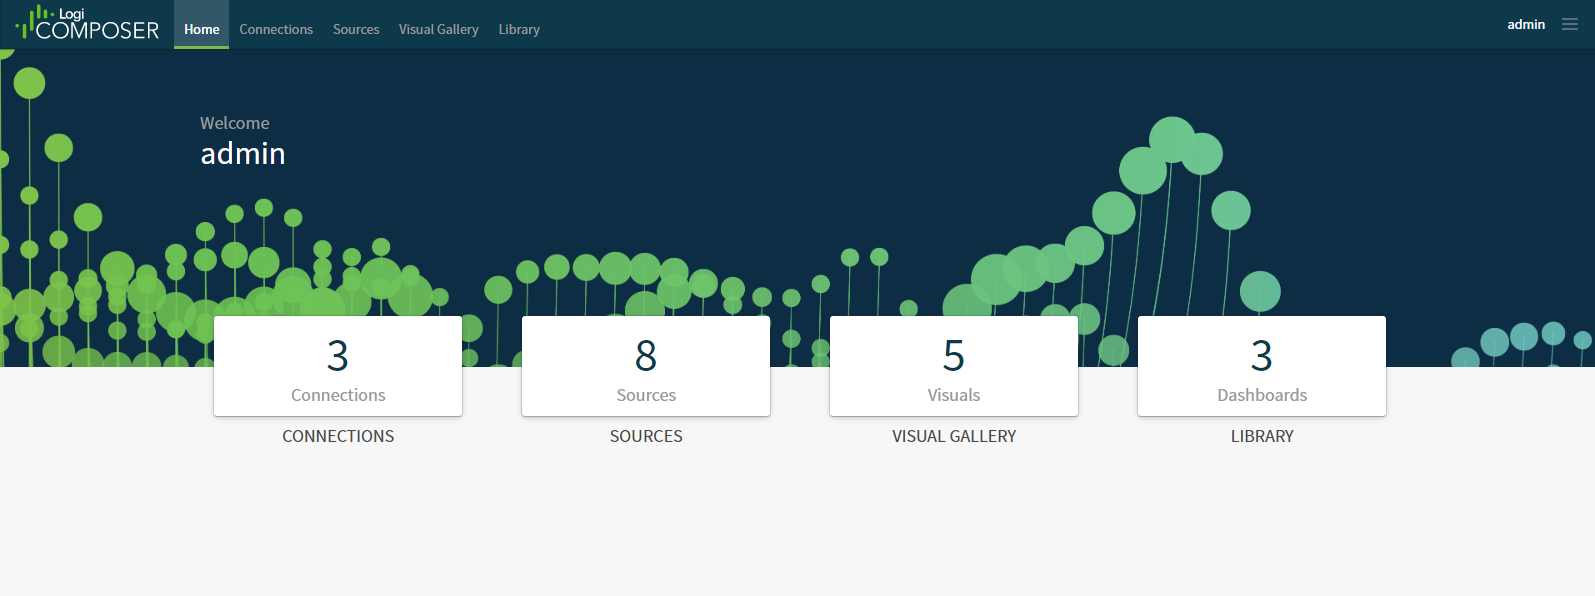
Easily access the home page from anywhere in the UI by selecting the Composer logo in the upper left corner or by selecting <b>Home</b> on the top-level navigation banner.

<Frame>
  <img src="https://mintcdn.com/insightsoftware-preview/StJJCeTmWK0u1SbF/images/image_761.png?fit=max&auto=format&n=StJJCeTmWK0u1SbF&q=85&s=360c7fe5b41b075dd1610058561901db" alt="Composer Home Page" href="https://logi-composer-v24.insightsoftware.com/hc/article_attachments/3075461357069" width="1595" height="596" data-path="images/image_761.png" />
</Frame>

Depending on your application privileges, this home page displays the numbers of connection definitions, data source configuration definitions, visuals, and dashboards in the environment. It also provides easy access to lists of connection and data source configuration definitions, the Visual Gallery, and the dashboard library. The home page does not show information or provide links for resources that your application privileges restricts you from viewing. The following additional selections are possible.

<table cellspacing="0" class="TableStyle-GENERIC-TABLESTYLE"><thead><tr class="TableStyle-GENERIC-TABLESTYLE-Head-Header1"><th class="TableStyle-GENERIC-TABLESTYLE-HeadE-Column1-Header1">Category</th><th class="TableStyle-GENERIC-TABLESTYLE-HeadD-Column1-Header1">Description</th></tr></thead><tbody><tr class="TableStyle-GENERIC-TABLESTYLE-Body-Body1"><td class="TableStyle-GENERIC-TABLESTYLE-BodyE-Column1-Body1">Connections</td><td class="TableStyle-GENERIC-TABLESTYLE-BodyD-Column1-Body1"><p>Shows the number of connections defined in your environment. Select this box to manage connections to data stores. The Connections page appears. </p><p>See Manage Data Discovery Data Store Connections.</p></td></tr><tr class="TableStyle-GENERIC-TABLESTYLE-Body-Body2"><td class="TableStyle-GENERIC-TABLESTYLE-BodyE-Column1-Body2">Sources</td><td class="TableStyle-GENERIC-TABLESTYLE-BodyD-Column1-Body2"><p>Shows the number of data source configurations defined in your environment. Select this box to manage data source configurations. The Sources page appears. </p><p>See Manage Visual Data Discovery Data Sources.</p></td></tr><tr class="TableStyle-GENERIC-TABLESTYLE-Body-Body1"><td class="TableStyle-GENERIC-TABLESTYLE-BodyE-Column1-Body1">Visual Gallery</td><td class="TableStyle-GENERIC-TABLESTYLE-BodyD-Column1-Body1"><p>Shows the number of visuals defined in your environment. Select this box to manage visuals in the Visual Gallery. The Visuals page appears. </p><p>See Manage Visuals and Use the Visual Gallery.</p></td></tr><tr class="TableStyle-GENERIC-TABLESTYLE-Body-Body2" data-mc-conditions="Logi_Conditions.b-ComposerOnly"><td class="TableStyle-GENERIC-TABLESTYLE-BodyB-Column1-Body2">Library</td><td class="TableStyle-GENERIC-TABLESTYLE-BodyA-Column1-Body2"><p>Shows the number of dashboards defined in your library. Select the <b>Dashboards:</b> box to manage dashboards. The dashboard library appears. </p><p>See Manage Dashboards and [Use the Library for Dashboards](/logi-symphony/composer/v24/dashboards/use-the-library-for-dashboards).</p></td></tr></tbody></table>

In addition to these selections, the user name you logged in with is shown in this work area. You can select the included hamburger icon ( <InlineImage src="/images/image_110.png" alt="" href="https://logi-composer-v24.insightsoftware.com/hc/article_attachments/3075496568205" />) to access the [UI menu](https://logi-composer-v24.insightsoftware.com/hc/en-us/articles/38068711264397-The-Composer-UI-Menu).
