> ## Documentation Index
> Fetch the complete documentation index at: https://insightsoftware-preview.mintlify.site/llms.txt
> Use this file to discover all available pages before exploring further.

# Modify Bar Charts

export const InlineImage = ({src, href, alt = "", size = "medium", customSize, position = "left", children}) => {
  const sizeClasses = {
    small: "w-6 h-6",
    medium: "w-8 h-8",
    large: "w-12 h-12",
    xlarge: "w-16 h-16"
  };
  const ImageComponent = () => <img src={src} alt={alt} className={customSize ? '' : sizeClasses[size]} style={{
    verticalAlign: 'baseline',
    display: 'inline-block',
    margin: '0',
    padding: '0',
    border: 'none',
    maxHeight: '1em',
    ...customSize ? {
      width: customSize,
      height: customSize
    } : {
      width: '1em',
      height: '1em'
    }
  }} />;
  const imageElement = href ? <a href={href} className="inline-block border-b-0 no-underline">
            <ImageComponent />
        </a> : <ImageComponent />;
  return <>
            {position === "left" && imageElement}
            {position === "left" && " "}
            {children}
            {position === "right" && " "}
            {position === "right" && imageElement}
        </>;
};

When you first create a standard bar chart or a multiple metric bar chart, the default settings specified in the data source configuration are used to create the visuals.

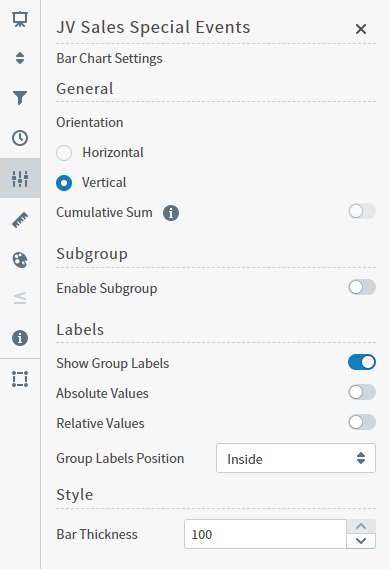
Use the Settings sidebar to further refine your selected bar chart.

<Frame>
  <img src="https://mintcdn.com/insightsoftware-preview/StJJCeTmWK0u1SbF/images/image_827.png?fit=max&auto=format&n=StJJCeTmWK0u1SbF&q=85&s=d3e8f81eb6935cad4a777520119ce40c" alt="Adjust settings for your bar chart here" width="390" height="569" data-path="images/image_827.png" />
</Frame>

<table cellspacing="0" class="TableStyle-GENERIC-TABLESTYLE"><thead><tr class="TableStyle-GENERIC-TABLESTYLE-Head-Header1"><th class="TableStyle-GENERIC-TABLESTYLE-HeadE-Column1-Header1">Setting</th><th class="TableStyle-GENERIC-TABLESTYLE-HeadD-Column1-Header1">Description</th></tr></thead><tbody><tr class="TableStyle-GENERIC-TABLESTYLE-Body-Body1"><td class="TableStyle-GENERIC-TABLESTYLE-BodyE-Column1-Body1">Orientation</td><td class="TableStyle-GENERIC-TABLESTYLE-BodyD-Column1-Body1">Select Horizontal or Vertical orientation for the bars. </td></tr><tr class="TableStyle-GENERIC-TABLESTYLE-Body-Body2"><td class="TableStyle-GENERIC-TABLESTYLE-BodyE-Column1-Body2">Cumulative Sum</td><td class="TableStyle-GENERIC-TABLESTYLE-BodyD-Column1-Body2"><p>When enabled, Composer updates the visual to add the previous value to the next value, and both the original and cumulative value for selected items are displayed as a tool tip. </p><p>In Bar visuals, this feature is only available when data is grouped by a Time field, and when the Enable Subgroup setting is disabled.</p></td></tr><tr class="TableStyle-GENERIC-TABLESTYLE-Body-Body1"><td class="TableStyle-GENERIC-TABLESTYLE-BodyE-Column1-Body1">Subgroup</td><td class="TableStyle-GENERIC-TABLESTYLE-BodyD-Column1-Body1"><p>Slide on (to the right) the <b>Enable Subgroup:</b> slider to enable a subgroup style. After enabling a subgroup style, select the style for the chart:<b>Clustered Bar Chart:</b>, <b>Stacked Bar Chart:</b>, or <b>100% Stacked Bar Chart:</b>.</p><p>If Subgroups are enabled, you can define the visibility and position of their labels.</p></td></tr><tr class="TableStyle-GENERIC-TABLESTYLE-Body-Body2"><td class="TableStyle-GENERIC-TABLESTYLE-BodyE-Column1-Body2">Show Group Labels</td><td class="TableStyle-GENERIC-TABLESTYLE-BodyD-Column1-Body2">Enable to display labels for group values.</td></tr><tr class="TableStyle-GENERIC-TABLESTYLE-Body-Body1"><td class="TableStyle-GENERIC-TABLESTYLE-BodyE-Column1-Body1">Absolute Values</td><td class="TableStyle-GENERIC-TABLESTYLE-BodyD-Column1-Body1">Enable to display the data in absolute values.</td></tr><tr class="TableStyle-GENERIC-TABLESTYLE-Body-Body2"><td class="TableStyle-GENERIC-TABLESTYLE-BodyE-Column1-Body2">Relative Values</td><td class="TableStyle-GENERIC-TABLESTYLE-BodyD-Column1-Body2">Enable to display the data in relative values.</td></tr><tr class="TableStyle-GENERIC-TABLESTYLE-Body-Body1"><td class="TableStyle-GENERIC-TABLESTYLE-BodyE-Column1-Body1">Group Labels Position or Subgroup Labels Position</td><td class="TableStyle-GENERIC-TABLESTYLE-BodyD-Column1-Body1">Select a position option for the group or subgroup labels: <b>Outside horizontal:</b>, <b>Outside diagonal:</b>, or <b>Outside vertical:</b>.</td></tr><tr class="TableStyle-GENERIC-TABLESTYLE-Body-Body2"><td class="TableStyle-GENERIC-TABLESTYLE-BodyB-Column1-Body2">Style</td><td class="TableStyle-GENERIC-TABLESTYLE-BodyA-Column1-Body2">Specify the bar thickness for the chart.</td></tr></tbody></table>
